8 Reliability
The Dynamic Learning Maps® (DLM®) Alternate Assessment System reports student results as discrete mastery classifications derived from diagnostic classification models (DCMs) and aggregations of the individual classifications. As such, methods for estimating the reliability must reflect the innovative assessment design and unique reporting structure of the DLM System. The approach draws on previous research from classification-based assessments to describe the reliability of student results. This chapter discusses the methods used to estimate reliability, the factors that are likely to affect variability in reliability results, and an overall summary of reliability evidence.
8.1 Background Information on Reliability Methods
Reliability estimates quantify the degree of precision in a test score. Expressed another way, a reliability index specifies how likely scores are to vary from one test administration to another due to chance. Historically, reliability has been quantified using indices such as the Guttman-Cronbach alpha (Cronbach, 1951; Guttman, 1945), which provides an index of the proportion of variance in a test score that is due to variance in the trait. Values closer to 1.0 indicate variation in test scores comes from individual differences in the trait, whereas values closer to 0.0 indicate variation in test scores comes from random error.
Many traditional measures of reliability exist; their differences are due to assumptions each measure makes about the nature of the data from a test. For instance, the Spearman-Brown reliability formula assumes items are parallel, contributing equal amounts of information about the trait and having equal variance. The Guttman-Cronbach alpha assumes tau-equivalent items (i.e., items with equal information about the trait but not necessarily equal variances). As such, the alpha statistic is said to subsume the Spearman-Brown statistic, meaning that if the data meet the stricter definition of Spearman-Brown, then alpha will be equal to Spearman-Brown. As a result, inherent in any discussion of reliability is the fact that the metric of reliability is accurate to the extent that the assumptions of the test are met.
The DLM assessments are scored using diagnostic classification models (DCMs), which assume that students’ knowledge, skills, and understandings are represented by discrete mastery statuses, rather than a continuous latent trait that characterizes more traditional classical test theory and item response theory models. As such, reliability-estimation methods based on item response theory estimates of ability are not applicable for the DLM assessments. Therefore, the reliability evidence may appear different from that reported when test scores are produced using traditional psychometric techniques such as classical test theory or item response theory. However, interpretation of indices for DLM assessments is consistent with traditional approaches. When a test is perfectly reliable (i.e., it has an index value of 1), any variation in test scores comes from individual differences in the trait within the sample in which the test was administered. When a test has zero reliability, then any variation in test scores comes solely from random error.
DCMs are models that produce classifications based on probability estimates for students. For the DLM System, the classification estimates are based on the set of attributes across the alternate achievement standards on which each student was assessed. The alternate achievement standards are themselves organized into larger content strands. In DLM terms, each content strand is called a topic, each of which is made up of standards called Essential Elements (EEs). Each EE is available at three linkage levels of complexity, which are the attributes in the DCM For more information on the specification of the DCMs, see Chapter 5 of this manual.: Initial, Precursor, and Target. Topics are organized into overarching domains for the subject. For the end-of-instruction Biology assessment, results are reported for topics, while the elementary, middle school, and high school assessment report results for the domain.
DLM testlets are written with items measuring the linkage level. Because of the DLM administration design, students do not take testlets outside of a single linkage level within an EE. Students take a single testlet measuring a given EE and linkage level; consequently, data obtained when students respond to testlets at adjacent linkage levels within an EE are sparse. Therefore, a linkage level DCM is used to score the assessment (i.e., estimate mastery proficiency; see Chapter 5 in this manual for more information).
The DCMs produce student-level posterior probabilities for each linkage level for which a student is assessed, with a threshold of 0.8 specified for demonstrating mastery. To guard against the model being overly influential, two additional scoring rules are applied. Students can also demonstrate mastery by providing correct responses to at least 80% of the items measuring the EE and linkage level. For a description of how often each scoring rule is utilized, see Chapter 7 of this manual. Furthermore, because students are not assessed at more than one linkage level within an EE, students who do not meet mastery status for any assessed linkage level are assigned mastery status for the linkage level two levels below the lowest level on which they are assessed (unless the lowest level tested is either the Initial or Precursor, in which case students are considered nonmasters of all linkage levels within the EE). See Chapter 7 of this manual for a complete description of scoring rules for the DLM assessments.
The DLM score reports display linkage level mastery for each EE. Linkage level results are also aggregated for EEs within each topic in Biology and domain in science grade bands. Because of differences in the organization of the assessment blueprints, score reports in Biology summarize student results for EEs measuring each topic, while those in general science summarize student results for EEs measuring each domain. Reliability evidence for each type of science assessment is provided consistent with the level used to summarize performance in the student reports. Score reports also summarize overall performance with a performance level classification. The classification is determined by summing all linkage levels mastered and comparing the value with cut points determined during standard setting. For more information on cut points, see Chapter 6 of the 2015–2016 Technical Manual—Science (Dynamic Learning Maps Consortium, 2017). For more information on score reports, see Chapter 7 of the 2015–2016 Technical Manual—Science (Dynamic Learning Maps Consortium, 2017).
Consistent with the levels at which DLM results are reported, this chapter provides reliability evidence at six levels: (1) the classification accuracy of each linkage level within each EE (linkage level reliability), (2) the classification accuracy summarized for the three linkage levels (conditional evidence by linkage level), (3) the number of linkage levels mastered within each EE (EE reliability), (4) the number of linkage levels mastered within each topic in Biology and domain in science grade bands (topic or domain reliability), (5) the total number of linkage levels mastered (subject reliability), and (6) the classification to overall performance level (performance level reliability). As described in the next section, reliability evidence comes from simulated retests in which assessment data are generated for students with the estimated model parameters and student mastery probabilities.
The reliability methods and evidence presented in this chapter adhere to guidance given in the Standards for Educational and Psychological Testing (American Educational Research Association et al., 2014). Where relevant, evidence provided in accordance with specific standards is noted.
8.2 Methods of Obtaining Reliability Evidence
Because the DLM psychometric model produces complex mastery results summarized at multiple levels of aggregation (linkage level, EE, topic or domain, subject, and performance level), rather than a traditional raw or scale score value, methods for evaluating reliability were based on simulated retests. For a simulation-based method of computing reliability, we generate simulated examinees with known characteristics, simulate assessment data using calibrated-model parameters, score the simulated retests using calibrated-model parameters, and compare estimated examinee characteristics with those characteristics known to be true in the simulation. For DLM assessments, the known characteristics of the simulated examinees are the set of linkage levels the examinee has mastered and not mastered.
Most methods for estimating the reliability of assessments scaled with DCMs are limited to attribute-level summaries of reliability (for a review see Sinharay & Johnson, 2019). Accordingly, these methods do not generalize to aggregated summaries of mastery classifications, such as those reported for DLM assessments. Simulated retests offer one method for estimating the reliability of DCM-based assessments at multiple levels of aggregation. At the attribute level (i.e., individual mastery classifications), simulated retests provide reliability estimates that are highly consistent with nonsimulation-based methods (Thompson, 2020). However, unlike the nonsimulation-based methods, simulated retests are able to support the evaluation of reliability for aggregations of individual mastery classifications (Thompson et al., 2019). In addition to supporting the evaluation of reliability evidence at multiple levels of reporting, simulated retests provide results consistent with classical reliability metrics in that perfect reliability is evidenced by consistency in classification, and zero reliability is evidenced by a lack of classification consistency.
The simulated retests used to estimate reliability for DLM versions of scores and classifications consider the unique design and administration of DLM assessments. Students typically take only 3–5 items per EE. Simulated retests are based on a replication of the administration process, including adaptive routing between testlets, and uses students’ known mastery classifications from the operational assessment. Therefore, students may not receive the same testlets in the simulation as they did during their actual assessment (i.e., routing decisions may be different or different testlets may be assigned from the pool of available testlets). This means that the simulated retest offers a genuine approximation of actual retest assignment for any given student. Simulated retests replicate results of DLM assessments from actual examinees based on administration procedures specific to the DLM assessments. However, the use of simulation produces approximate estimates of reliability, which are contingent on the accuracy of the current scoring model. That is, reliability estimates are an upper bound on the true reliability. For the 2021–2022 administration, on advice of the DLM Technical Advisory Committee, the procedure for simulating the retest was updated to incorporate additional uncertainty into the simulation-assigned mastery status and testlets for each resampled student. The remaining sections of this chapter describe the current procedures and results with these updates, which provide a better estimate of the true reliability.
Simulated retests were conducted to assemble reliability evidence according to the Standards’ assertion that “the general notion of reliability/precision is defined in terms of consistency over replications of the testing procedure” (American Educational Research Association et al., 2014, p. 35). The reliability evidence reported here supports “interpretation for each intended score use,” as Standard 2.0 recommends (American Educational Research Association et al., 2014, p. 42). The “appropriate evidence of reliability/precision” (American Educational Research Association et al., 2014, p. 42) was assembled using a methodology that aligns to the design of the assessment and interpretations of results. The procedures used to assemble reliability evidence align with all applicable standards.
8.2.1 Reliability Sampling Procedure
The simulation design that was used to obtain the reliability estimates uses a resampling design to mirror DLM assessment data. In accordance with Standard 2.1, the sampling design uses the entire set of operational assessment data to generate simulated examinees (American Educational Research Association et al., 2014, p. 42). Using this process guarantees that the simulation takes on characteristics of the DLM operational assessment data that are likely to affect reliability results. For one simulated examinee, the process is as follows:
Draw with replacement the student record of one student from the operational assessment data (i.e., the spring assessment window). Use the student’s originally scored linkage level mastery probabilities as the true values for the simulated student data. For linkage levels the drawn student was assessed on during the operational assessment, generate the mastery status from a Bernoulli distribution with a probability equal to the mastery probability. For linkage levels the student was not assessed on during the operational assessment, the probability is either fixed to 1 if the student has mastered a higher linkage level for the EE during the operational assessment, or is defined as the base rate of class membership for linkage levels higher than those assessed operationally (see Chapter 5 of this manual).
Simulate a new assessment based on administration rules. In practice, this means simulating one testlet at a time and applying routing rules (see Chapter 4 of this manual) to assign subsequent simulated testlets. Item responses are simulated for the assigned testlets from calibrated model parameters, Calibrated parameters were treated as true and fixed values for the simulated retests. conditional on the linkage level mastery status determined in Step 1.
Score the simulated item responses using the operational DLM scoring procedure, estimating linkage level mastery or nonmastery for the simulated student. See Chapter 7 of this manual for more information. All three scoring rules were implemented when scoring the simulated retests to be consistent with the operational scoring procedure.
Calculate the aggregated summaries of linkage level mastery for the simulated retests (i.e., EE, topic or domain, subject, and performance level).
Compare the estimated linkage level mastery and aggregated summaries from the simulated retests to the values reported for the drawn student on the operational assessment.
Steps 1 through 5 are then repeated 100,000 times for each grade or course to create the full simulated retests data set. Figure 8.1 shows the steps of the simulation process as a flow chart.
Figure 8.1: Simulation Process for Creating Reliability Evidence
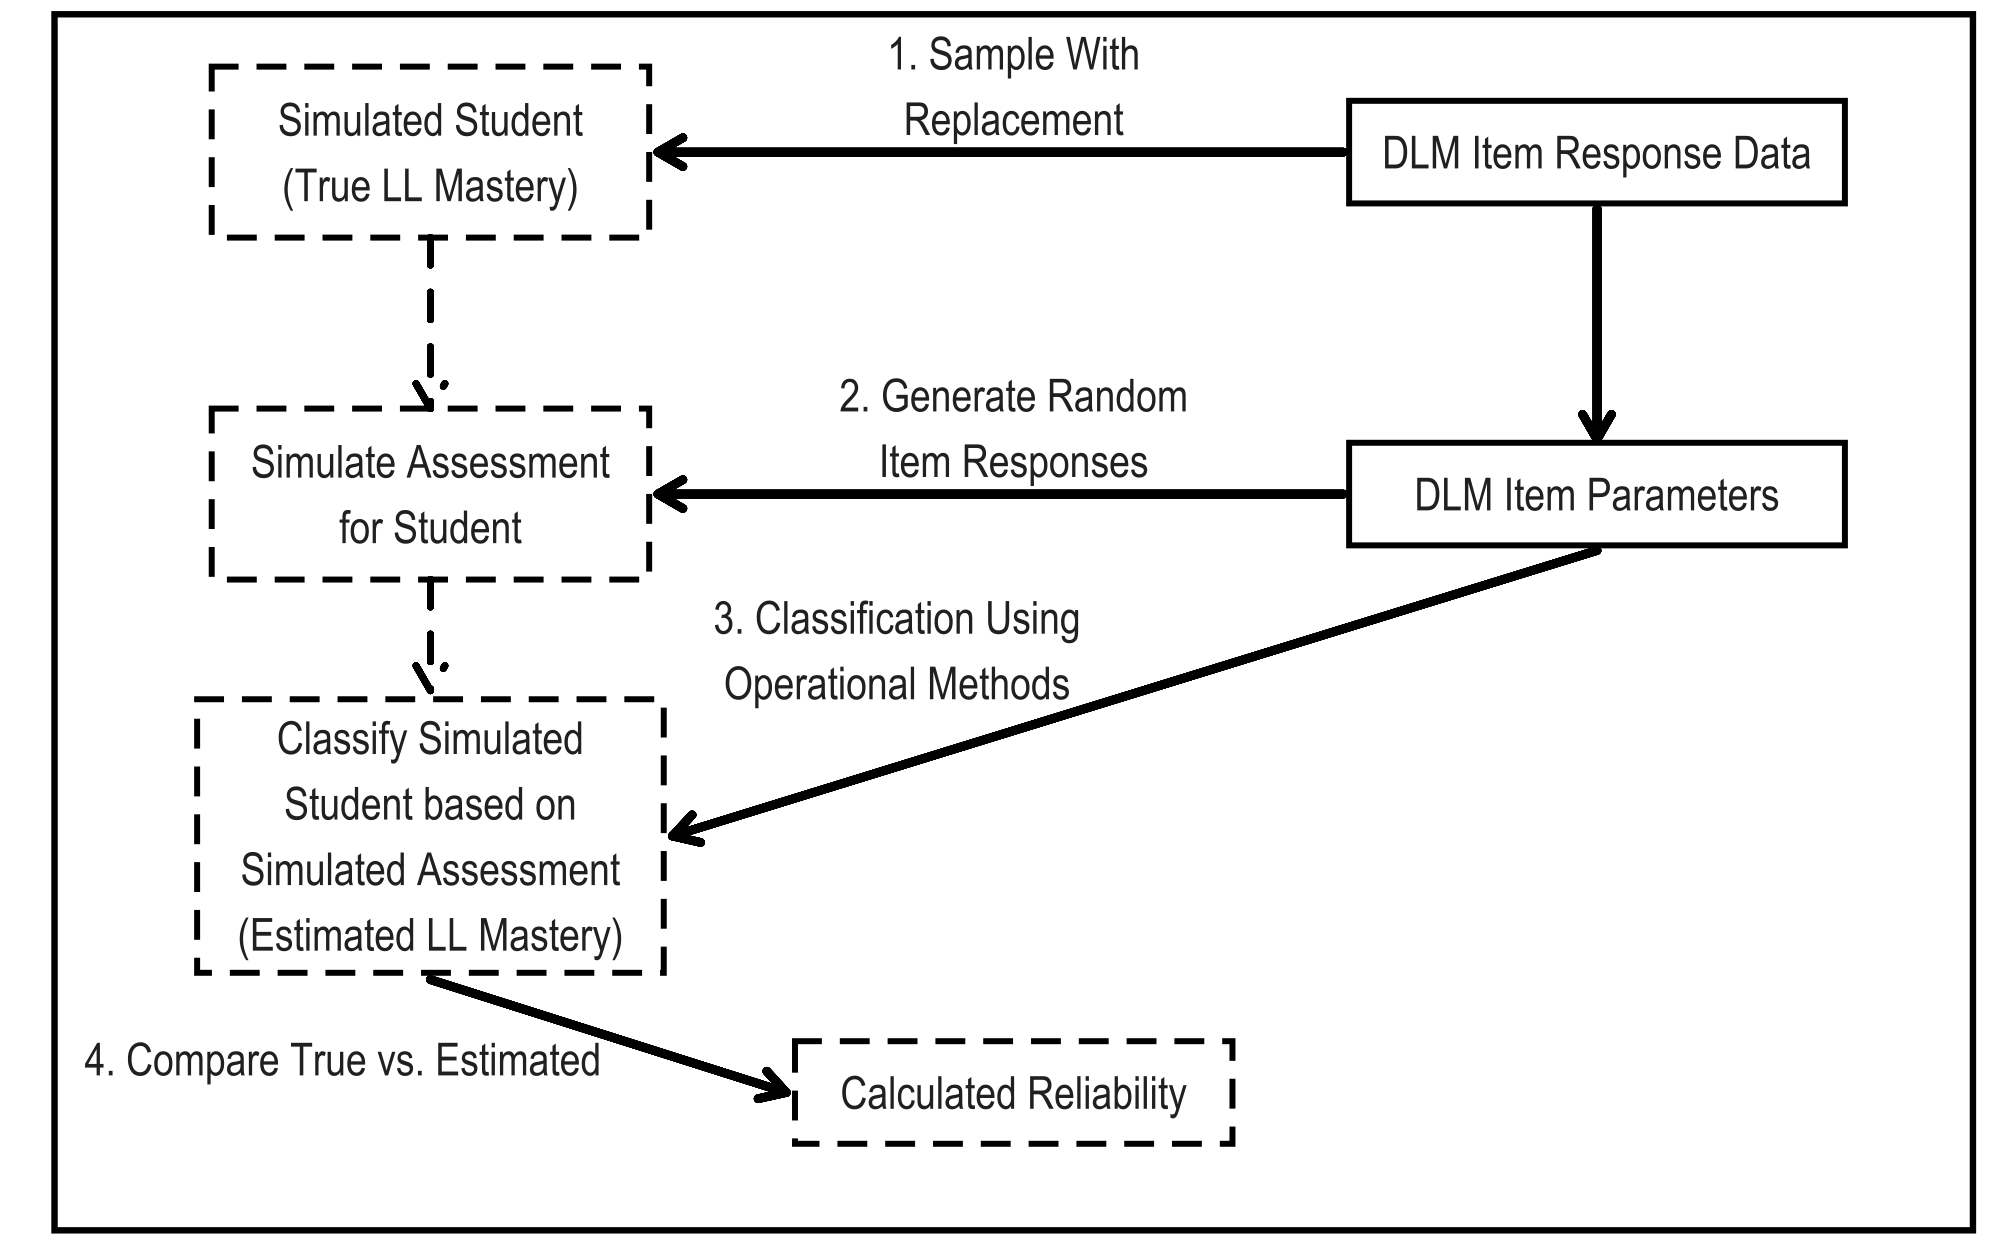
Note. LL = linkage level.
8.3 Reliability Evidence
This chapter provides reliability evidence for six levels of data: (1) linkage level reliability, (2) conditional reliability by linkage level, (3) EE reliability, (4) domain and topic reliability, (5) subject reliability, and (6) performance level reliability, which ensures that the simulation and resulting reliability evidence are aligned with Standard 2.2 (American Educational Research Association et al., 2014, p. 42). Additionally, providing reliability evidence for each of the six levels ensures that these reliability estimation procedures meet Standard 2.5 (American Educational Research Association et al., 2014, p. 43).
Reliability evidence at each level is reported using various correlation coefficients. Correlation estimates mirror estimates of reliability from contemporary measures such as the Guttman-Cronbach alpha. For linkage level and conditional evidence by linkage level reliability, the tetrachoric correlation estimates the relationship between true and estimated linkage level mastery statuses. The tetrachoric correlation is a special case of the polychoric in which the variables are discrete. Both the polychoric and tetrachoric correlations provide more useful estimates of relationships between ordinal and discrete variables that would otherwise be attenuated using the standard correlation (i.e., the Pearson coefficient). For EE and performance level reliability, the polychoric correlation estimates the relationship between two ordinal variables: the true performance level or true number of linkage levels mastered and the corresponding estimated value. Finally, for subject and topic or domain reliability, the Pearson correlation estimates the relationship between the true and estimated numbers of linkage levels mastered.
Reliability evidence at each level is also reported using correct classification rates (raw and chance corrected), indicating the proportion of estimated classifications that match true classifications. The chance-corrected classification rate, kappa, represents the proportion of error reduced above chance. Kappa values above .6 indicate substantial-to-perfect agreement between estimated and true values (Landis & Koch, 1977). However, Cohen’s kappa may be limited in this context. Numerous studies have shown that the kappa statistic tends to be too conservative when there are unbalanced categories (Cicchetti & Feinstein, 1990; Feinstein & Cicchetti, 1990; O’Leary et al., 2014; Pontius & Millones, 2011). This is often the case for DLM linkage levels, where the base rate of class membership can be less than .3 or greater than .7. See Chapter 5 of this manual for a summary of base rates of class membership. Thus, it is important to interpret the kappa statistic with caution and within the context of the other reporting metrics.
8.3.1 Linkage Level Reliability Evidence
Evidence at the linkage level comes from comparing the true and estimated mastery status for each of the 102 linkage levels in the operational DLM assessment. This level of reliability reporting is the finest grain of reporting, and while it does not have a directly comparable classical test theory or item response theory analogue, its inclusion is important because it is the level at which mastery classifications are made for DLM assessments. All reported summary statistics of linkage level reliability are based on the resulting contingency tables: the comparison of true (operational assessment) and estimated (simulated retest) mastery statuses across all simulated examinees.
In addition to summary statistics from the simulated retests, we also calculated the classification consistency metric, \(\hat{P}_C\), described by Johnson & Sinharay (2018). As the name implies, the classification consistency index is a measure of how consistent the student-level classifications are for each linkage level, and it is calculated from the estimated DCM parameters (see Chapter 5 of this manual for a description of the model parameters). The classification consistency metric is based on the estimated model parameters, and thus is only applicable to the linkage level, which is the unit of model estimation. See Chapter 5 of this manual for a complete description of the model specification. This metric is not based on simulated retests, and thus provides a measure of reliability independent from the simulation.
For each statistic, figures are given comparing the results of all 102 linkage levels. We report linkage level reliability evidence based on three summary statistics from the simulated retests and the nonsimulation-based classification consistency:
- the tetrachoric correlation between estimated and true mastery status,
- the classification agreement for the mastery status of each linkage level,
- the classification consistency (Johnson & Sinharay, 2018), and
- the classification agreement Cohen’s kappa for the mastery status of each linkage level.
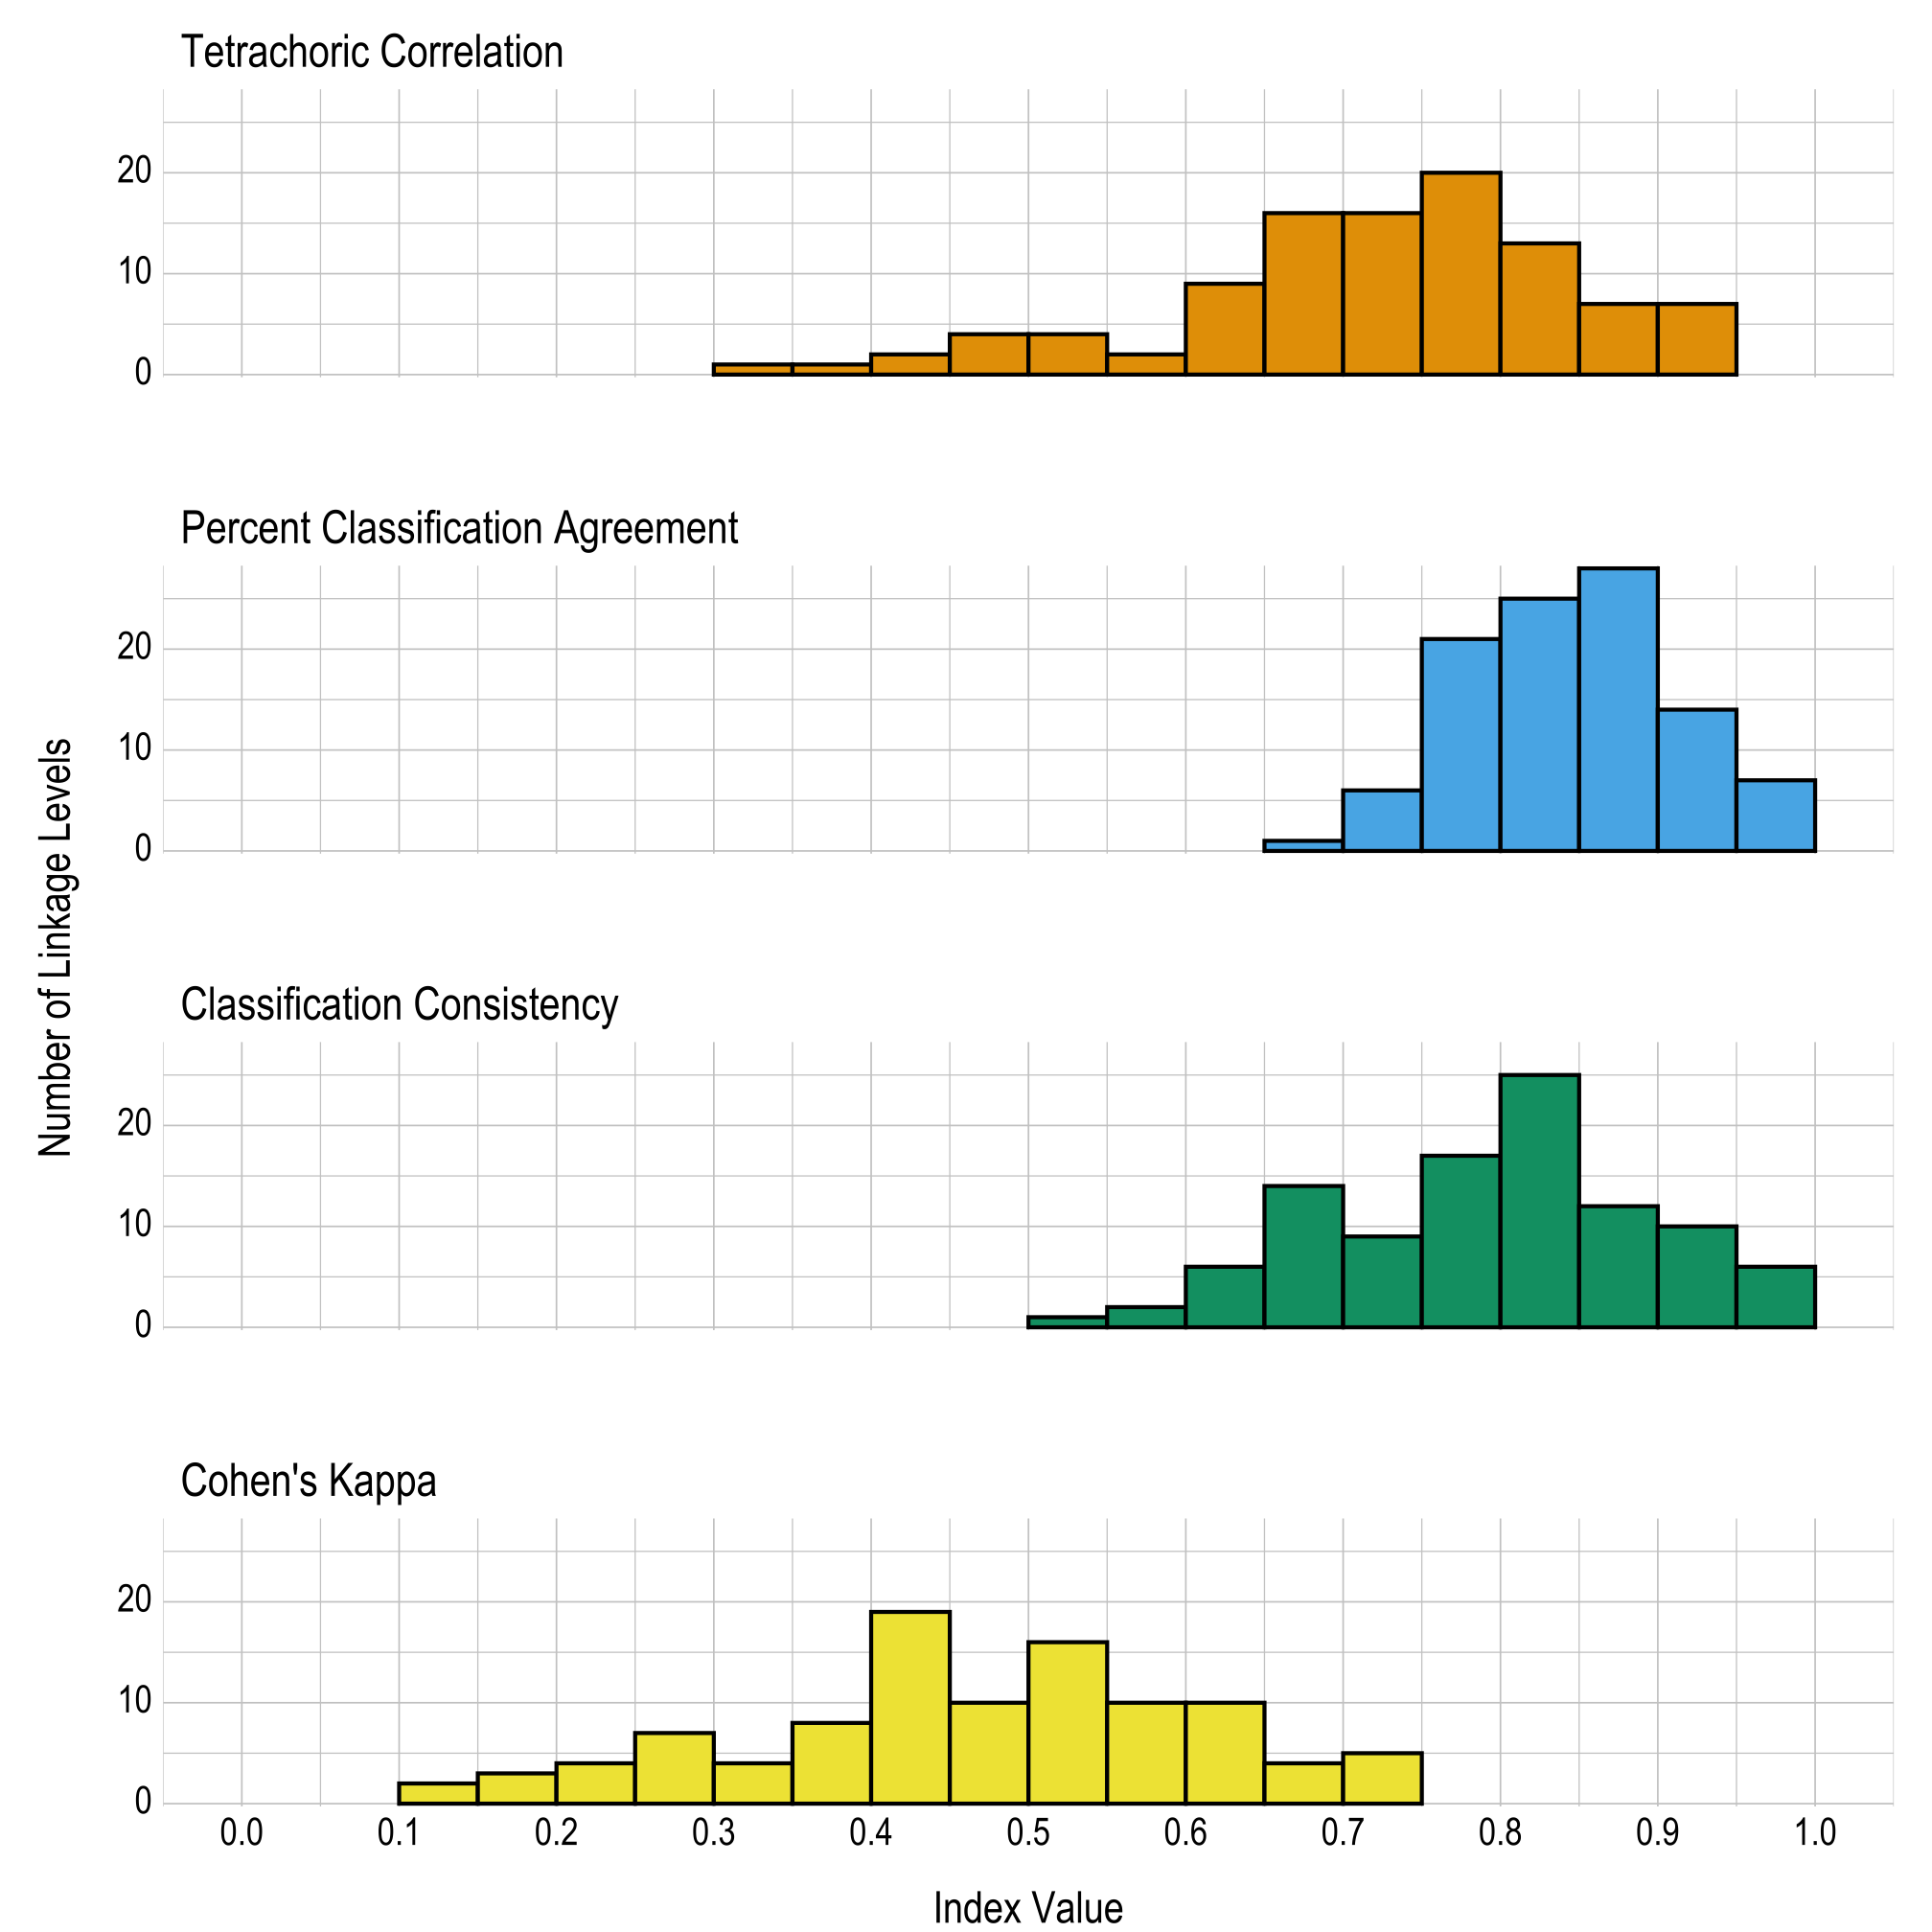
Results are given in both tabular and graphical forms. Table 8.1 and Figure 8.2 provide proportions and the number of linkage levels, respectively, that fall within prespecified ranges of values for the four linkage level reliability summary statistics (i.e., tetrachoric correlation, classification agreement rate, classification consistency, and Cohen’s kappa). Table 8.2 provides the four reliability summary statistics for each linkage level.
The correlations and classification agreement rates show reliability evidence for the classification of mastery at the linkage level. Across all linkage levels, 14 (14%) had a tetrachoric correlation below .6, 0 (0%) had a percent classification agreement below .6, 3 (3%) had a classification consistency below .6, and 83 (81%) had a Cohen’s kappa below .6. As previously described, Cohen’s kappa may be limited in this context due to unbalanced class categories. Thus, the other three metrics provide a more useful evaluation of linkage level reliability.
Notably, Johnson & Sinharay (2018) recommend a cutoff of .7 for fair classification consistency. Overall, 79 (77%) linkage levels meet this cutoff, indicating that the linkage level classifications show a high degree of reliability. For a summary of the closely related classification accuracy, see Chapter 5 of this manual.
|
Index range
|
|||||||||
|---|---|---|---|---|---|---|---|---|---|
| Reliability index | 0.00–0.59 | 0.60–0.64 | 0.65–0.69 | 0.70–0.74 | 0.75–0.79 | 0.80–0.84 | 0.85–0.89 | 0.90–0.94 | 0.95–1.00 |
| Tetrachoric correlation | .137 | .088 | .157 | .157 | .196 | .127 | .069 | .069 | .000 |
| Percent classification agreement | .000 | .000 | .010 | .059 | .206 | .245 | .275 | .137 | .069 |
| Classification consistency | .029 | .059 | .137 | .088 | .167 | .245 | .118 | .098 | .059 |
| Cohen’s kappa | .814 | .098 | .039 | .049 | .000 | .000 | .000 | .000 | .000 |
Figure 8.2: Summaries of Linkage Level Reliability
8.3.2 Conditional Reliability Evidence by Linkage Level
Traditional assessment programs often report conditional standard errors of measurement to indicate how the precision of measurement differs along the score continuum. The DLM assessment system does not report total or scale score values. Therefore, traditional measures of conditional reliability are not applicable. In particular, standard errors of measurement (inversely related to reliability) that are conditional on a continuous trait are based on the calculation of Fisher’s information, which involves taking the second derivative-model likelihood function with respect to the latent trait. When classifications are the latent traits, however, the likelihood is not a smooth function regarding levels of the trait and therefore cannot be differentiated (Henson & Douglas, 2005; Templin & Bradshaw, 2013). In other words, because diagnostic classification modeling does not produce a total score or scale score, traditional methods of calculating conditional standard errors of measurement are not appropriate. However, because DLM assessments were designed to span the continuum of students’ varying knowledge, skills, and understandings as defined by the three linkage levels, evidence of reliability can be summarized for each linkage level to approximate conditional evidence over all EEs, similar to a conditional standard error of measurement for a total score.
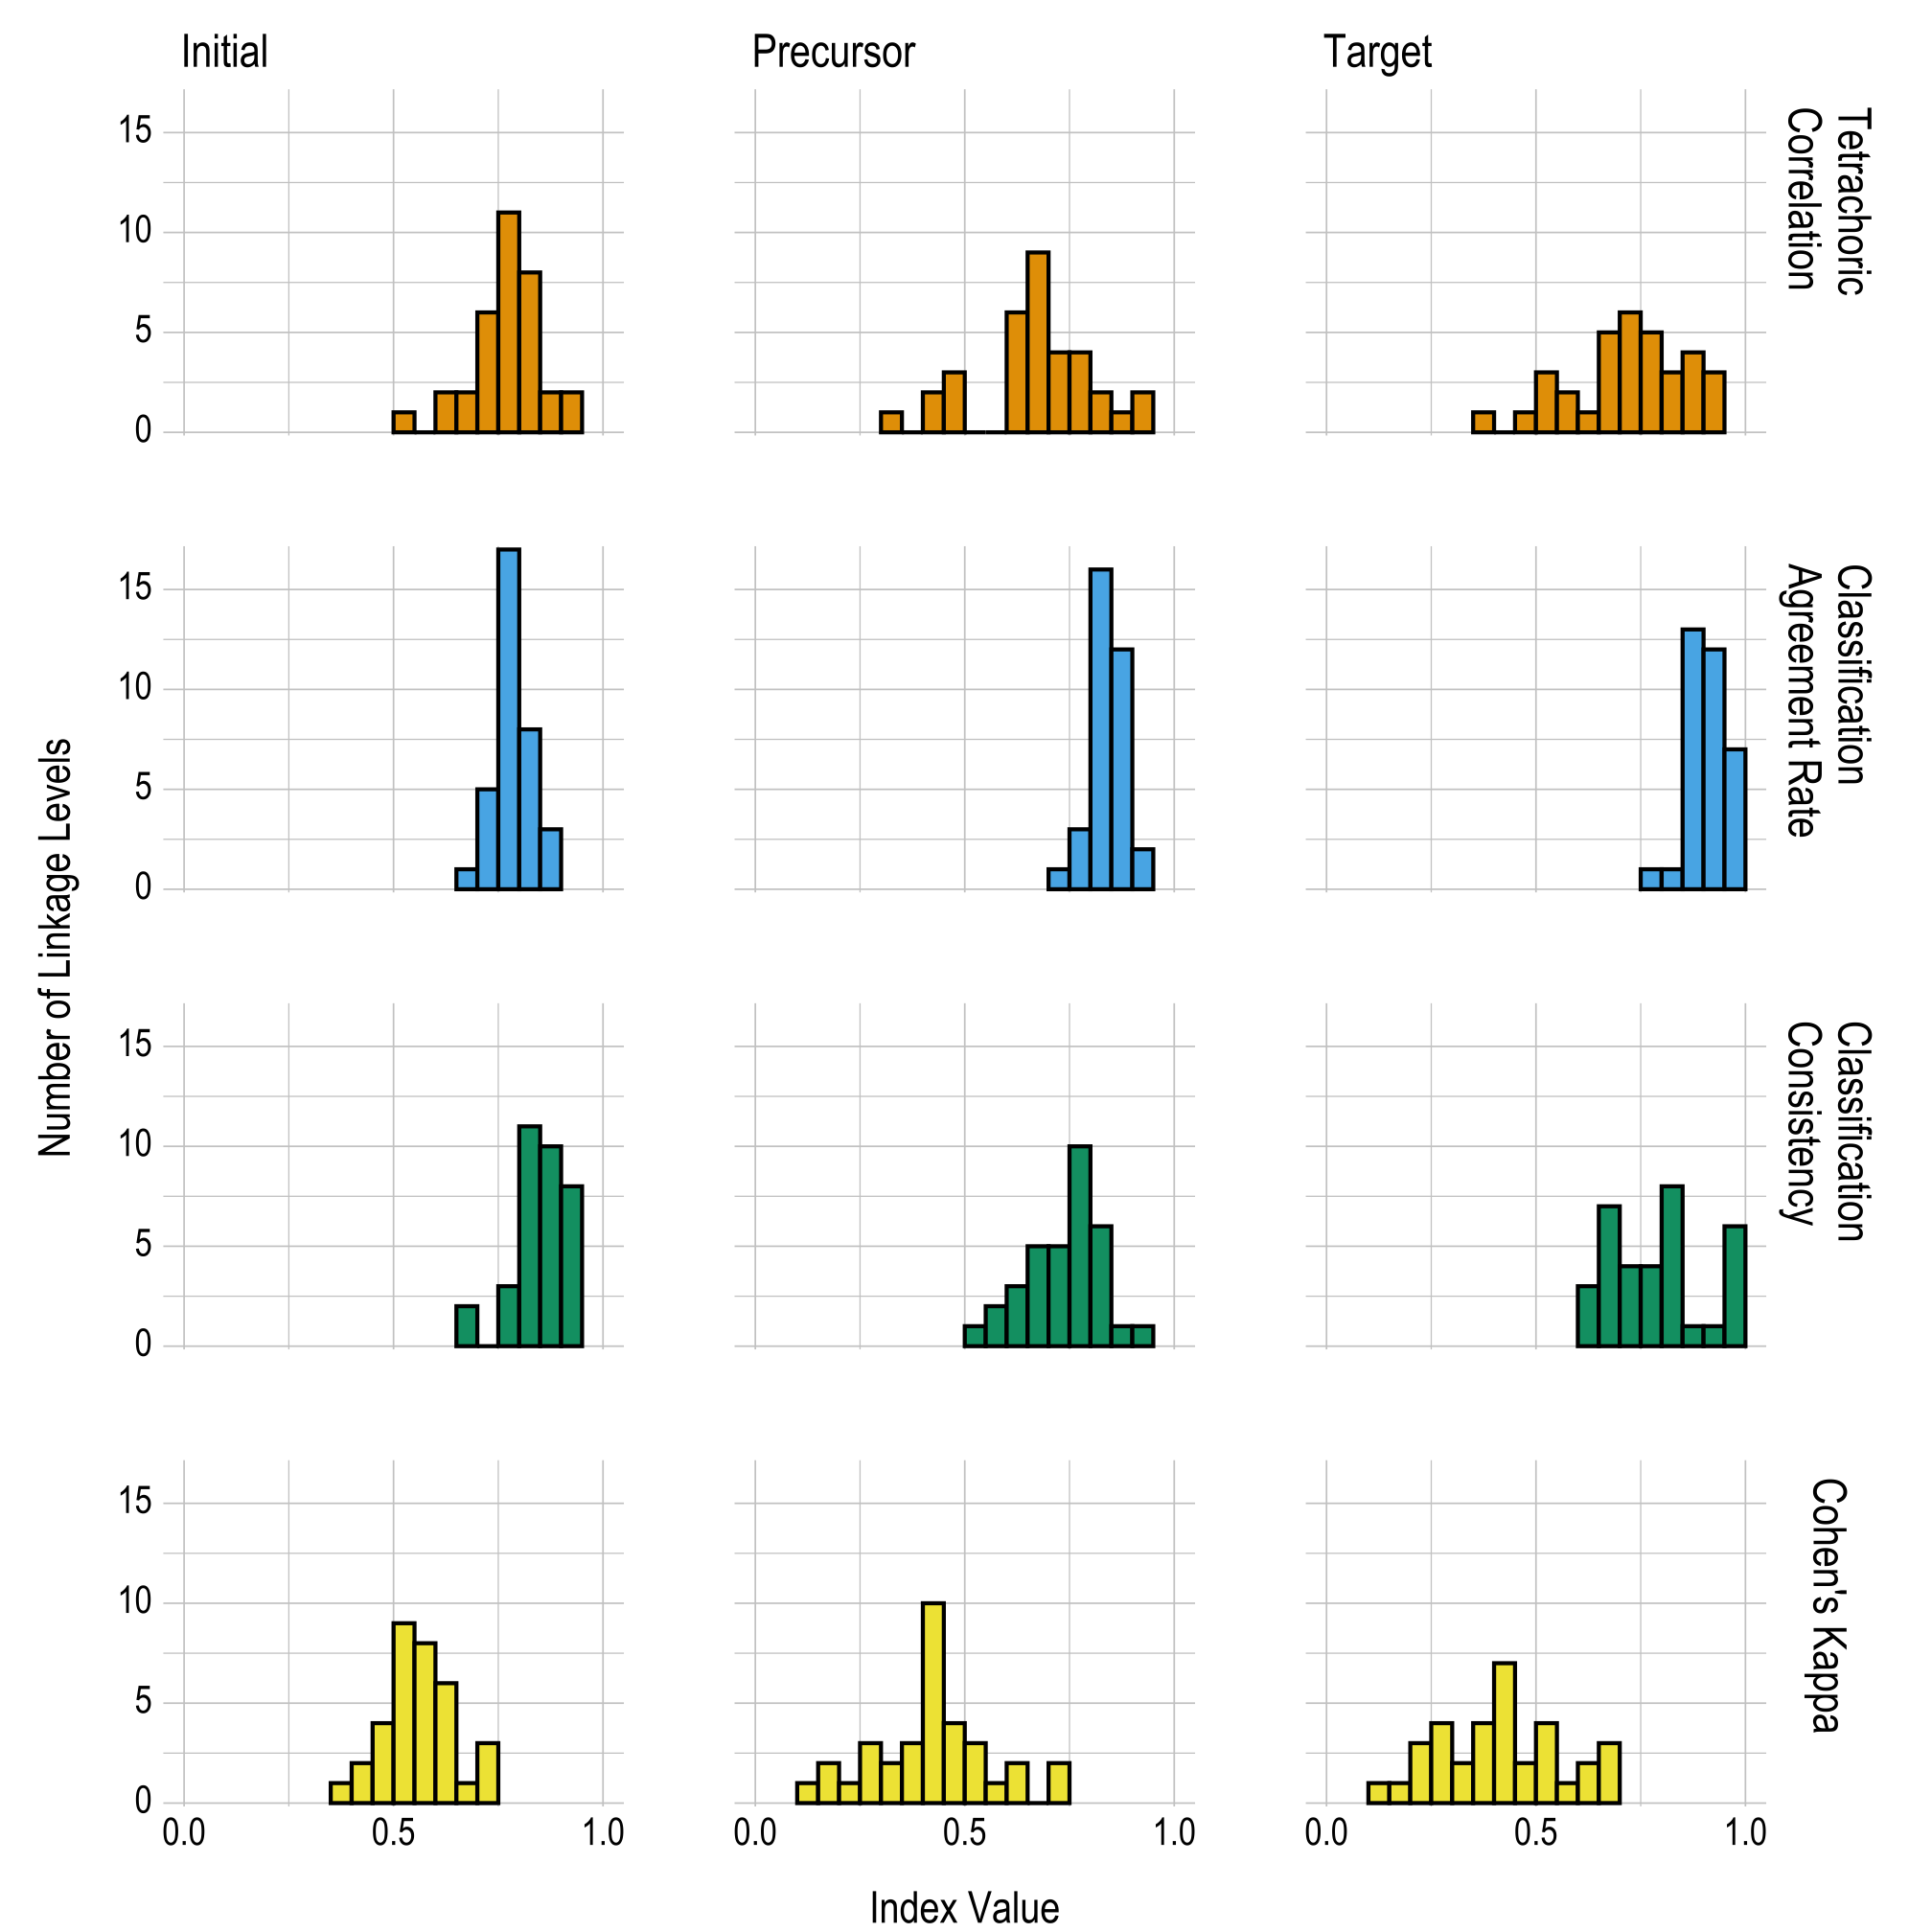
Conditional reliability evidence by linkage level is based on the true and estimated mastery statuses for each linkage level, as summarized by each of the three levels. Results are reported using the same four statistics used to summarize the overall linkage level reliability evidence (i.e., tetrachoric correlation, classification agreement rate, classification consistency, and Cohen’s kappa).
Table 8.3 and Figure 8.3 provide the proportions and the number of linkage levels, respectively, that fall within prespecified ranges of values for each linkage level for the four reliability summary statistics (i.e., tetrachoric correlation, classification agreement rate, classification consistency, and Cohen’s kappa). The correlations and classification agreement rates generally indicate that all three linkage levels provide reliable classifications of student mastery; results are fairly consistent across all linkage levels for each of the four statistics reported. Table 8.2 in the previous section provides the four reliability summary statistics for each individual linkage level.
|
Index range
|
|||||||||
|---|---|---|---|---|---|---|---|---|---|
| Reliability index | 0.00–0.59 | 0.60–0.64 | 0.65–0.69 | 0.70–0.74 | 0.75–0.79 | 0.80–0.84 | 0.85–0.89 | 0.90–0.94 | 0.95–1.00 |
| Initial | |||||||||
| Tetrachoric correlation | .029 | .059 | .059 | .176 | .324 | .235 | .059 | .059 | .000 |
| Percent classification agreement | .000 | .000 | .029 | .147 | .500 | .235 | .088 | .000 | .000 |
| Classification consistency | .000 | .000 | .059 | .000 | .088 | .324 | .294 | .235 | .000 |
| Cohen’s kappa | .706 | .176 | .029 | .088 | .000 | .000 | .000 | .000 | .000 |
| Precursor | |||||||||
| Tetrachoric correlation | .176 | .176 | .265 | .118 | .118 | .059 | .029 | .059 | .000 |
| Percent classification agreement | .000 | .000 | .000 | .029 | .088 | .471 | .353 | .059 | .000 |
| Classification consistency | .088 | .088 | .147 | .147 | .294 | .176 | .029 | .029 | .000 |
| Cohen’s kappa | .882 | .059 | .000 | .059 | .000 | .000 | .000 | .000 | .000 |
| Target | |||||||||
| Tetrachoric correlation | .206 | .029 | .147 | .176 | .147 | .088 | .118 | .088 | .000 |
| Percent classification agreement | .000 | .000 | .000 | .000 | .029 | .029 | .382 | .353 | .206 |
| Classification consistency | .000 | .088 | .206 | .118 | .118 | .235 | .029 | .029 | .176 |
| Cohen’s kappa | .853 | .059 | .088 | .000 | .000 | .000 | .000 | .000 | .000 |
Figure 8.3: Conditional Reliability Evidence Summarized by Linkage Level
8.3.3 Essential Element Reliability Evidence
The first level of linkage level aggregation is the EE. EE-level results are reported as the highest linkage level mastered for each EE. Because EE-level results are an aggregation of the individual linkage level classifications, more traditional measures of the reliability (e.g., the classification consistency used for linkage levels) are not possible. Therefore, reliability results are only reported based on the simulated retests, which do offer a method for evaluating the reliability of aggregated classifications (Thompson et al., 2019).
Three statistics are used to summarize reliability evidence for EEs:
- the polychoric correlation between true and estimated numbers of linkage levels mastered within an EE,
- the classification agreement rate for the number of linkage levels mastered within an EE, and
- the classification agreement Cohen’s kappa for the number of linkage levels mastered within an EE.
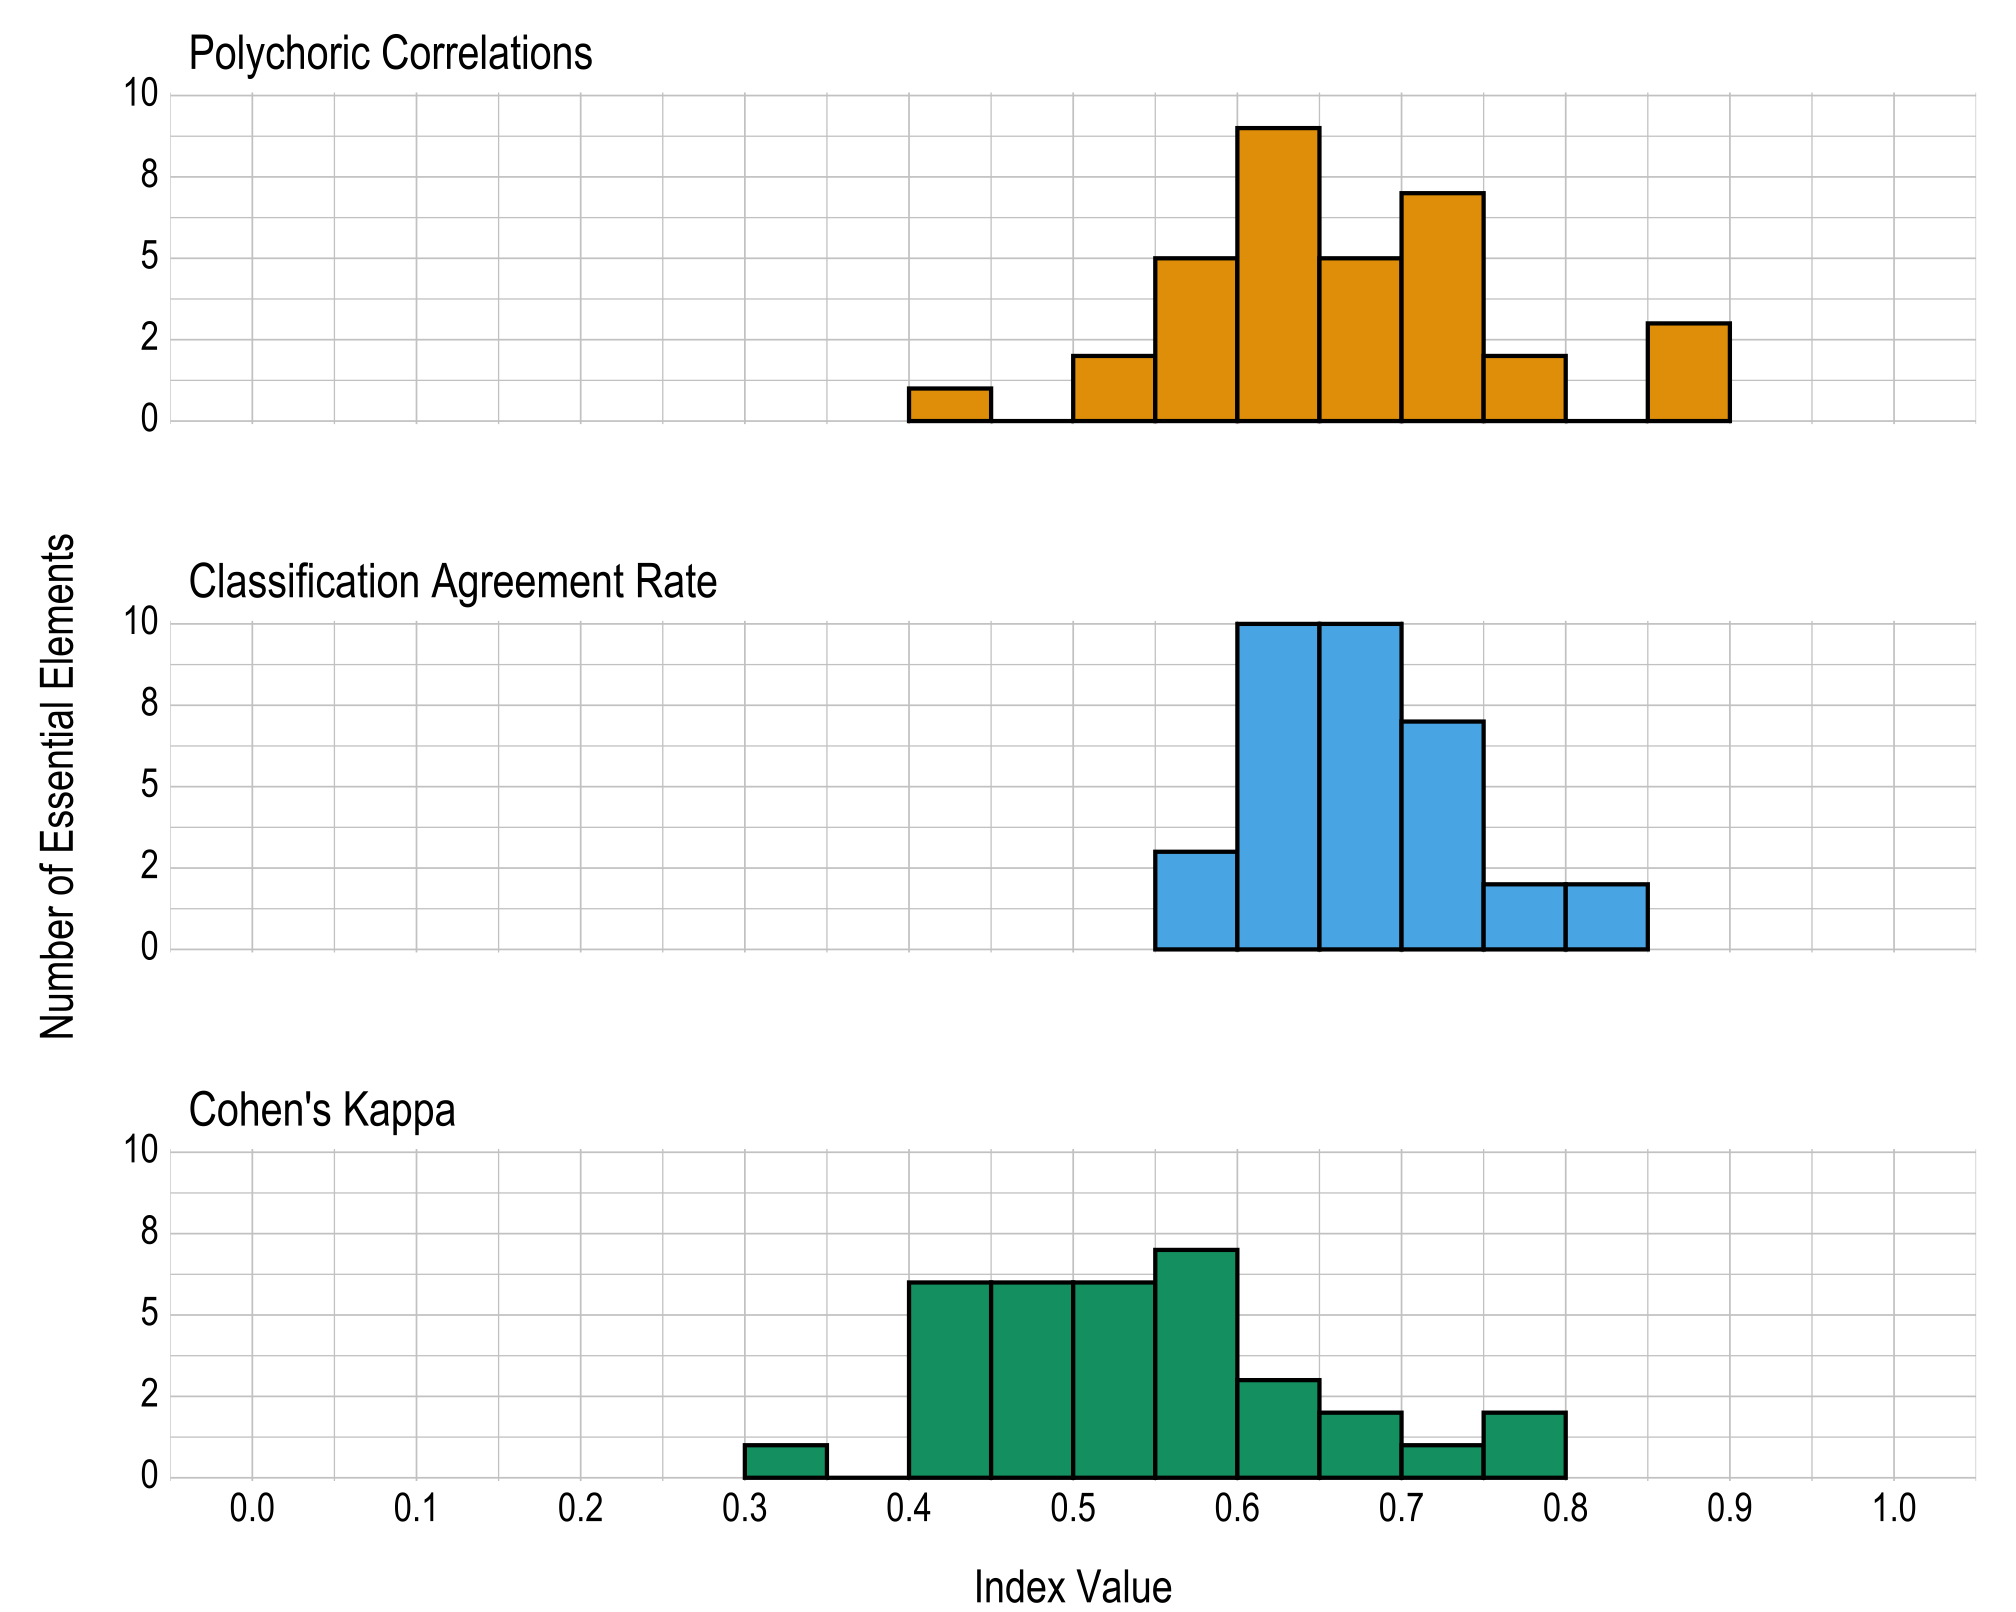
Results are given in both tabular and graphical forms. Table 8.4 and Figure 8.4 provide the proportions and the number of EEs, respectively, falling within prespecified ranges of values for the three reliability summary statistics (i.e., classification agreement rate, kappa, correlation). Across all EEs, 8 (24%) had a polychoric correlation below .6, 3 (9%) had a percent classification agreement below .6, and 26 (76%) had a Cohen’s kappa below .6. In general, the reliability summaries show strong evidence for reliability for the number of linkage levels mastered within EEs. Table 8.5 provides the three reliability summary statistics for each EE.
|
Index range
|
|||||||||
|---|---|---|---|---|---|---|---|---|---|
| Reliability index | 0.00–0.59 | 0.60–0.64 | 0.65–0.69 | 0.70–0.74 | 0.75–0.79 | 0.80–0.84 | 0.85–0.89 | 0.90–0.94 | 0.95–1.00 |
| Polychoric correlation | .235 | .265 | .147 | .206 | .059 | .000 | .088 | .000 | .000 |
| Percent classification agreement | .088 | .294 | .294 | .206 | .059 | .059 | .000 | .000 | .000 |
| Cohen’s kappa | .765 | .088 | .059 | .029 | .059 | .000 | .000 | .000 | .000 |
Figure 8.4: Number of Linkage Levels Mastered Within Essential Element Reliability Summaries
8.3.4 Domain and Topic Reliability Evidence
Science EEs are organized into topics and domains, which are akin to content strands for other assessments. Because Individual Student Score Reports summarize the number and percentage of linkage levels students mastered for each science domain or topic in Biology, See Chapter 7 of the 2015–2016 Technical Manual—Science (Dynamic Learning Maps Consortium, 2017) for more information. we also provide reliability evidence at these levels in their respective grade or course, in accordance with Standard 2.2, which indicates that reliability evidence should be provided consistent with the level(s) of scoring (American Educational Research Association et al., 2014, p. 42).
Reliability at the domain or topic level provides consistency evidence for the number of linkage levels mastered across all EEs in each science domain for each grade or topic for Biology. Domain and topic reliability evidence compares the true and estimated number of linkage levels mastered across all tested levels for each of the three domains and Biology topics. Reliability is reported with three summary numbers:
- the Pearson correlation between the true and estimated number of linkage levels mastered within a domain or Biology topic,
- the classification agreement rate for which linkage levels were mastered as averaged across all simulated students for each domain or Biology topic, and
- the classification agreement Cohen’s kappa for which linkage levels were mastered, as averaged across all simulated students for each domain or Biology topic.
Table 8.6 shows the three summary values for each domain in each grade and topic in Biology. Classification rate information is provided in accordance with Standard 2.16 (American Educational Research Association et al., 2014, p. 46). The correlation and Cohen’s kappa summary statistics included in Table 8.6 also align with Standard 2.19 (American Educational Research Association et al., 2014, p. 47). The correlations range from .172 to 1.000, the average classification agreement rates range from .922 to .999, and the average Cohen’s kappa values range from .830 to .999. This indicates that, overall, the domain and topic results provided on score reports are reliable.
8.3.5 Subject Reliability Evidence
The next level of aggregation of linkage level mastery is for the subject overall. Subject reliability provides consistency evidence for the number of linkage levels mastered across all EEs for a given grade or course. Because students are assessed on multiple linkage levels across the assessed EEs in science, subject reliability evidence is similar to reliability evidence for testing programs that use summative assessments to describe overall performance in a subject. That is, the number of linkage levels mastered within a subject is analogous to the number of items answered correctly (i.e., total score) in a different type of testing program.
Subject reliability evidence compares the true and estimated number of linkage levels mastered across all tested levels for a given subject. Because subject-level reporting summarizes the total number of linkage levels a student mastered, the statistics reported for subject reliability are the same as those reported for domain and topic reliability. Reliability is reported with three summary values:
- the Pearson correlation between the true and estimated number of linkage levels mastered within a subject,
- the classification agreement rate for which linkage levels were mastered, as averaged across all simulated students, and
- the classification agreement Cohen’s kappa for which linkage levels were mastered, as averaged across all simulated students.
Table 8.7 shows the three summary values for each grade and subject. The correlation between true and estimated number of linkage levels mastered ranges from .721 to .873. Students’ average classification agreement rates range from .866 to .956 and average Cohen’s kappa values range from .634 to .881. These values indicate that the total linkage levels mastered in each grade or course are reliably determined.
| Grade | Linkage levels mastered correlation | Average student classification agreement | Average student Cohen’s kappa |
|---|---|---|---|
| 3 | .873 | .956 | .881 |
| 4 | .783 | .909 | .731 |
| 5 | .803 | .918 | .760 |
| 6 | .789 | .909 | .745 |
| 7 | .807 | .904 | .736 |
| 8 | .747 | .866 | .634 |
| 9 | .763 | .892 | .702 |
| 10 | .779 | .913 | .766 |
| 11 | .734 | .892 | .701 |
| 12 | .754 | .902 | .730 |
| Biology | .721 | .896 | .657 |
8.3.6 Performance Level Reliability Evidence
The final level of linkage level mastery aggregation is at the overall performance level. Results for DLM assessments are reported using four performance levels. The scoring procedure sums the linkage levels mastered across all EEs, and cut points are applied to distinguish between the four performance categories. See Chapter 6 of the 2015–2016 Technical Manual—Science (Dynamic Learning Maps Consortium, 2017) and Chapter 6 of the 2018–2019 Technical Manual Update—Science (Dynamic Learning Maps Consortium, 2019) for details on the standard setting procedure to determine the cut points.
Performance level reliability provides evidence for how reliably students are classified to the four performance levels for each subject and grade level. Because the performance level is determined by the total number of linkage levels mastered, large fluctuations in the number of linkage levels mastered, or fluctuation around the cut points, could affect how reliably students are assigned into performance categories. The performance level reliability evidence is based on the observed and estimated performance levels from the simulated retests (i.e., based on the estimated total number of linkage levels mastered and predetermined cut points). Three statistics are included to provide a comprehensive summary of results:
- the polychoric correlation between the true and estimated performance levels within a grade and subject,
- the classification agreement rate between the true and estimated performance levels within a grade and subject, and
- the classification agreement Cohen’s kappa between the true and estimated performance levels within a grade and subject.
Table 8.8 presents this information across all grades in science. Polychoric correlations between true and estimated performance level range from .760 to .913. Classification agreement rates range from .638 to .790, and Cohen’s kappa values are between .594 and .817. These results indicate that the DLM scoring procedure of reporting performance levels based on total linkage levels mastered results in reliable classification of students to performance level categories.
| Grade | Polychoric correlation | Classification agreement rate | Cohen’s kappa |
|---|---|---|---|
| 3 | .913 | .790 | .817 |
| 4 | .821 | .714 | .646 |
| 5 | .844 | .782 | .663 |
| 6 | .832 | .715 | .707 |
| 7 | .841 | .707 | .725 |
| 8 | .773 | .655 | .630 |
| 9 | .787 | .638 | .616 |
| 10 | .806 | .705 | .662 |
| 11 | .760 | .656 | .594 |
| 12 | .776 | .666 | .608 |
| Biology | .761 | .694 | .606 |
8.4 Conclusion
In summary, reliability measures for the DLM assessment system address the standards set forth by American Educational Research Association et al. (2014). The methods are consistent with assumptions of diagnostic classification modeling and yield evidence to support the argument for internal consistency of the program for each level of reporting. The results indicate high levels of reliability for the individual linkage level mastery classifications, as well as for all levels of aggregation for which results are reported (i.e., EE, domain and topic, subject, and overall performance level). Because the reliability results depend on the model used to calibrate and score the assessment, any changes to the model or evidence obtained when evaluating model fit also affect reliability results. As with any selected methodology for evaluating reliability, the current results assume that the model and model parameters used to score DLM assessments are correct. However, unlike other traditional measures of reliability that often require unattainable assumptions about equivalent test forms, the simulation method described in this chapter provides a replication of the same test administration process used in the operational assessment, which provides a rigorous evaluation of the variation in student results across simulated repeated assessment administrations.