7 Reporting and Results
Chapter 7 of the Dynamic Learning Maps® (DLM®) Alternate Assessment System 2015–2016 Technical Manual—Science (Dynamic Learning Maps Consortium, 2017) describes assessment results for the 2015–2016 academic year, including student participation and performance summaries, and an overview of data files and score reports delivered to state education agencies. Technical Manual updates provide a description of data files, score reports, and results for each corresponding academic year.
This chapter presents spring 2022 student participation data; the percentage of students achieving at each performance level; and subgroup performance by gender, race, ethnicity, and English learner status. This chapter also reports the distribution of students by the highest linkage level mastered during spring 2022. Finally, this chapter describes updates made to score reports during the 2021–2022 operational year. For a complete description of score reports and interpretive guides, see Chapter 7 of the 2015–2016 Technical Manual—Science (Dynamic Learning Maps Consortium, 2017).
7.1 Student Participation
During spring 2022, assessments were administered to 44,375 students in 20 states. Counts of students tested in each state are displayed in Table 7.1. The assessments were administered by 18,451 educators in 11,006 schools and 4,164 school districts. A total of 388,092 test sessions were administered during the spring assessment window. One test session is one testlet taken by one student. Only test sessions that were complete at the close of the spring assessment window counted toward the total sessions.
| State | Students (n) |
|---|---|
| Alaska | 194 |
| Arkansas | 2,379 |
| Delaware | 334 |
| District of Columbia | 177 |
| Illinois | 4,612 |
| Iowa | 945 |
| Kansas | 911 |
| Maryland | 2,444 |
| Missouri | 2,298 |
| New Hampshire | 254 |
| New Jersey | 4,612 |
| New Mexico | 892 |
| New York | 7,779 |
| North Dakota | 233 |
| Oklahoma | 2,180 |
| Pennsylvania | 7,010 |
| Rhode Island | 411 |
| Utah | 3,558 |
| West Virginia | 677 |
| Wisconsin | 2,475 |
Table 7.2 summarizes the number of students assessed in each grade and course. More than 14,010 students participated in each of the elementary and the middle school grade bands. In an effort to increase science instruction beyond the tested grades, several states promoted participation in the science assessment at all grade levels (i.e., did not restrict participation to the grade levels required for accountability purposes). In high school, over 15,300 students participated. The differences in high school grade-level participation can be traced to differing state-level policies about the grade(s) in which students are assessed.
| Grade | Students (n) |
|---|---|
| 3 | 577 |
| 4 | 6,333 |
| 5 | 7,109 |
| 6 | 1,010 |
| 7 | 1,000 |
| 8 | 13,027 |
| 9 | 4,068 |
| 10 | 1,761 |
| 11 | 8,060 |
| 12 | 372 |
| Biology | 1,058 |
Table 7.3 summarizes the demographic characteristics of the students who participated in the spring 2022 administration. The distribution of students across the different subgroups was fairly consistent with prior years’ distributions. The majority of participants were male (67%) and white (60%). About 7% of students were monitored or eligible for English learning services.
| Subgroup | n | % |
|---|---|---|
| Gender | ||
| Male | 29,762 | 67.1 |
| Female | 14,574 | 32.8 |
| Nonbinary/undesignated | 39 | 0.1 |
| Race | ||
| White | 26,415 | 59.5 |
| African American | 9,210 | 20.8 |
| Two or more races | 5,143 | 11.6 |
| Asian | 2,170 | 4.9 |
| American Indian | 1,071 | 2.4 |
| Native Hawaiian or Pacific Islander | 283 | 0.6 |
| Alaska Native | 83 | 0.2 |
| Hispanic ethnicity | ||
| Non-Hispanic | 34,895 | 78.6 |
| Hispanic | 9,480 | 21.4 |
| English learning (EL) participation | ||
| Not EL eligible or monitored | 41,360 | 93.2 |
| EL eligible or monitored | 3,015 | 6.8 |
In addition to the spring assessment window, instructionally embedded science assessments are also made available for educators to optionally administer to students during the year. Results from the instructionally embedded assessments do not contribute to final summative scoring but can be used to guide instructional decision-making. Table 7.4 summarizes the number of students who completed at least one instructionally embedded assessment by state. A total of 4,139 students in 12 states took at least one instructionally embedded testlet during the 2021–2022 academic year.
| State | n |
|---|---|
| Arkansas | 660 |
| Delaware | 67 |
| Iowa | 319 |
| Kansas | 238 |
| Maryland | 1,191 |
| Missouri | 1,481 |
| New Jersey | 33 |
| New Mexico | 7 |
| New York | 3 |
| North Dakota | 46 |
| Oklahoma | 89 |
| Utah | 5 |
| Note. Maryland required administration of instructionally embedded assessments during fall 2021. |
Table 7.5 summarizes the number of instructionally embedded testlets taken in science. Across all states, students took 28,007 science testlets during the instructionally embedded window.
| Grade | n |
|---|---|
| 3 | 1,006 |
| 4 | 1,245 |
| 5 | 4,135 |
| 6 | 1,645 |
| 7 | 1,565 |
| 8 | 6,563 |
| 9 | 1,393 |
| 10 | 1,989 |
| 11 | 6,225 |
| 12 | 2,241 |
| Total | 28,007 |
7.2 Student Performance
Student performance on DLM assessments is interpreted using cut points, For a description of the standard setting process used to determine the cut points, see Chapter 6 of the 2015–2016 Technical Manual—Science (Dynamic Learning Maps Consortium, 2017). which describe student achievement using four performance levels. A student’s performance level is determined based on the total number of linkage levels mastered across the assessed EEs.
For the spring 2022 administration, student performance was reported using the same four performance levels approved by the DLM Governance Board for prior years:
- The student demonstrates Emerging understanding of and ability to apply content knowledge and skills represented by the EEs.
- The student’s understanding of and ability to apply targeted content knowledge and skills represented by the EEs is Approaching the Target.
- The student’s understanding of and ability to apply content knowledge and skills represented by the EEs is At Target. This performance level is considered to be meeting achievement expectations.
- The student demonstrates Advanced understanding of and ability to apply targeted content knowledge and skills represented by the EEs.
7.2.1 Overall Performance
Table 7.6 reports the percentage of students achieving at each performance level from the spring 2022 administration for science. At the elementary level, the percentage of students who achieved at the At Target or Advanced levels (i.e., proficient) was approximately 12%; in middle school the percentage of students meeting or exceeding At Target expectations was approximately 22%; in high school the percentage was approximately 15%; in end-of-instruction biology the percentage was approximately 14%.
| Grade | Emerging (%) | Approaching (%) | At Target (%) | Advanced (%) | At Target + Advanced (%) |
|---|---|---|---|---|---|
| 3 (n = 577) | 67.1 | 21.7 | 7.5 | 3.8 | 11.3 |
| 4 (n = 6,333) | 64.8 | 20.2 | 11.5 | 3.5 | 15.0 |
| 5 (n = 7,109) | 69.5 | 20.9 | 9.1 | 0.5 | 9.6 |
| 6 (n = 1,010) | 67.8 | 16.1 | 12.1 | 4.0 | 16.0 |
| 7 (n = 1,000) | 61.0 | 19.3 | 15.9 | 3.8 | 19.7 |
| 8 (n = 13,027) | 57.5 | 20.0 | 18.9 | 3.6 | 22.4 |
| 9 (n = 4,068) | 54.3 | 27.4 | 14.3 | 4.1 | 18.4 |
| 10 (n = 1,761) | 59.2 | 28.2 | 10.8 | 1.8 | 12.6 |
| 11 (n = 8,060) | 56.0 | 29.4 | 12.2 | 2.4 | 14.6 |
| 12 (n = 372) | 58.6 | 25.8 | 12.6 | 3.0 | 15.6 |
| Biology (n = 1,058) | 68.0 | 18.1 | 10.9 | 3.0 | 13.9 |
7.2.2 Subgroup Performance
Data collection for DLM assessments includes demographic data on gender, race, ethnicity, and English learning status. Table 7.7 summarizes the disaggregated frequency distributions for science, collapsed across all assessed grade levels. Although state education agencies each have their own rules for minimum student counts needed to support public reporting of results, small counts are not suppressed here because results are aggregated across states and individual students cannot be identified.
|
Emerging
|
Approaching
|
At Target
|
Advanced
|
At Target +
Advanced |
||||||
|---|---|---|---|---|---|---|---|---|---|---|
| Subgroup | n | % | n | % | n | % | n | % | n | % |
| Gender | ||||||||||
| Male | 17,862 | 60.0 | 6,704 | 22.5 | 4,260 | 14.3 | 936 | 3.1 | 5,196 | 17.5 |
| Female | 9,036 | 62.0 | 3,407 | 23.4 | 1,810 | 12.4 | 321 | 2.2 | 2,131 | 14.6 |
| Nonbinary/undesignated | 22 | 56.4 | 10 | 25.6 | 6 | 15.4 | 1 | 2.6 | 7 | 17.9 |
| Race | ||||||||||
| White | 15,778 | 59.7 | 6,137 | 23.2 | 3,750 | 14.2 | 750 | 2.8 | 4,500 | 17.0 |
| African American | 5,613 | 60.9 | 2,042 | 22.2 | 1,272 | 13.8 | 283 | 3.1 | 1,555 | 16.9 |
| Two or more races | 3,223 | 62.7 | 1,205 | 23.4 | 619 | 12.0 | 96 | 1.9 | 715 | 13.9 |
| Asian | 1,519 | 70.0 | 397 | 18.3 | 198 | 9.1 | 56 | 2.6 | 254 | 11.7 |
| American Indian | 552 | 51.5 | 268 | 25.0 | 187 | 17.5 | 64 | 6.0 | 251 | 23.4 |
| Native Hawaiian or Pacific Islander | 170 | 60.1 | 60 | 21.2 | 44 | 15.5 | 9 | 3.2 | 53 | 18.7 |
| Alaska Native | 65 | 78.3 | 12 | 14.5 | 6 | 7.2 | 0 | 0.0 | 6 | 7.2 |
| Hispanic ethnicity | ||||||||||
| Non-Hispanic | 21,161 | 60.6 | 7,955 | 22.8 | 4,799 | 13.8 | 980 | 2.8 | 5,779 | 16.6 |
| Hispanic | 5,759 | 60.7 | 2,166 | 22.8 | 1,277 | 13.5 | 278 | 2.9 | 1,555 | 16.4 |
| English learning (EL) participation | ||||||||||
| Not EL eligible or monitored | 25,142 | 60.8 | 9,424 | 22.8 | 5,654 | 13.7 | 1,140 | 2.8 | 6,794 | 16.4 |
| EL eligible or monitored | 1,778 | 59.0 | 697 | 23.1 | 422 | 14.0 | 118 | 3.9 | 540 | 17.9 |
7.3 Mastery Results
As described above, the student performance levels are determined by applying cut points to the total number of linkage levels mastered. In this section, we summarize student mastery of assessed EEs and linkage levels, including how students demonstrated mastery from among three scoring rules and the highest linkage level students tended to master.
7.3.1 Mastery Status Assignment
As described in Chapter 5 of this manual, student responses to assessment items are used to estimate the posterior probability that the student mastered each of the assessed linkage levels using diagnostic classification modeling. Students with a posterior probability of mastery greater than or equal to .80 are assigned a linkage level mastery status of 1, or mastered. Students with a posterior probability of mastery less than .80 are assigned a linkage level mastery status of 0, or not mastered. Maximum uncertainty in the mastery status occurs when the probability is .5 and maximum certainty when the probability approaches 0 or 1. After considering the risk of false positives and negatives and preliminary data analyses, and based on input from the DLM Technical Advisory Committee (TAC), the threshold used to determine mastery classifications was set at .80. In addition to the calculated probability of mastery, students could be assigned mastery of linkage levels within an EE in two other ways: correctly answering 80% of all items administered at the linkage level or through the two-down scoring rule. The two-down scoring rule was implemented to guard against students assessed at the highest linkage levels being overly penalized for incorrect responses. When a student did not demonstrate mastery of the assessed linkage level, mastery was assigned at two linkage levels below the level that was assessed.
Take, for example, a student who tested only on the Target linkage level of an EE. If the student demonstrated mastery of the Target linkage level, as defined by the .80 posterior probability of mastery cutoff or the 80% correct rule, then all linkage levels below and including the Target level would be categorized as mastered. If the student did not demonstrate mastery on the tested Target linkage level, then mastery would be assigned at two linkage levels below the tested linkage level (i.e., the Initial), rather than showing no evidence of mastery at all. Theoretical evidence for the use of the two-down rule based on DLM content structures is presented in Chapter 2 of the 2015–2016 Technical Manual—Science (Dynamic Learning Maps Consortium, 2017).
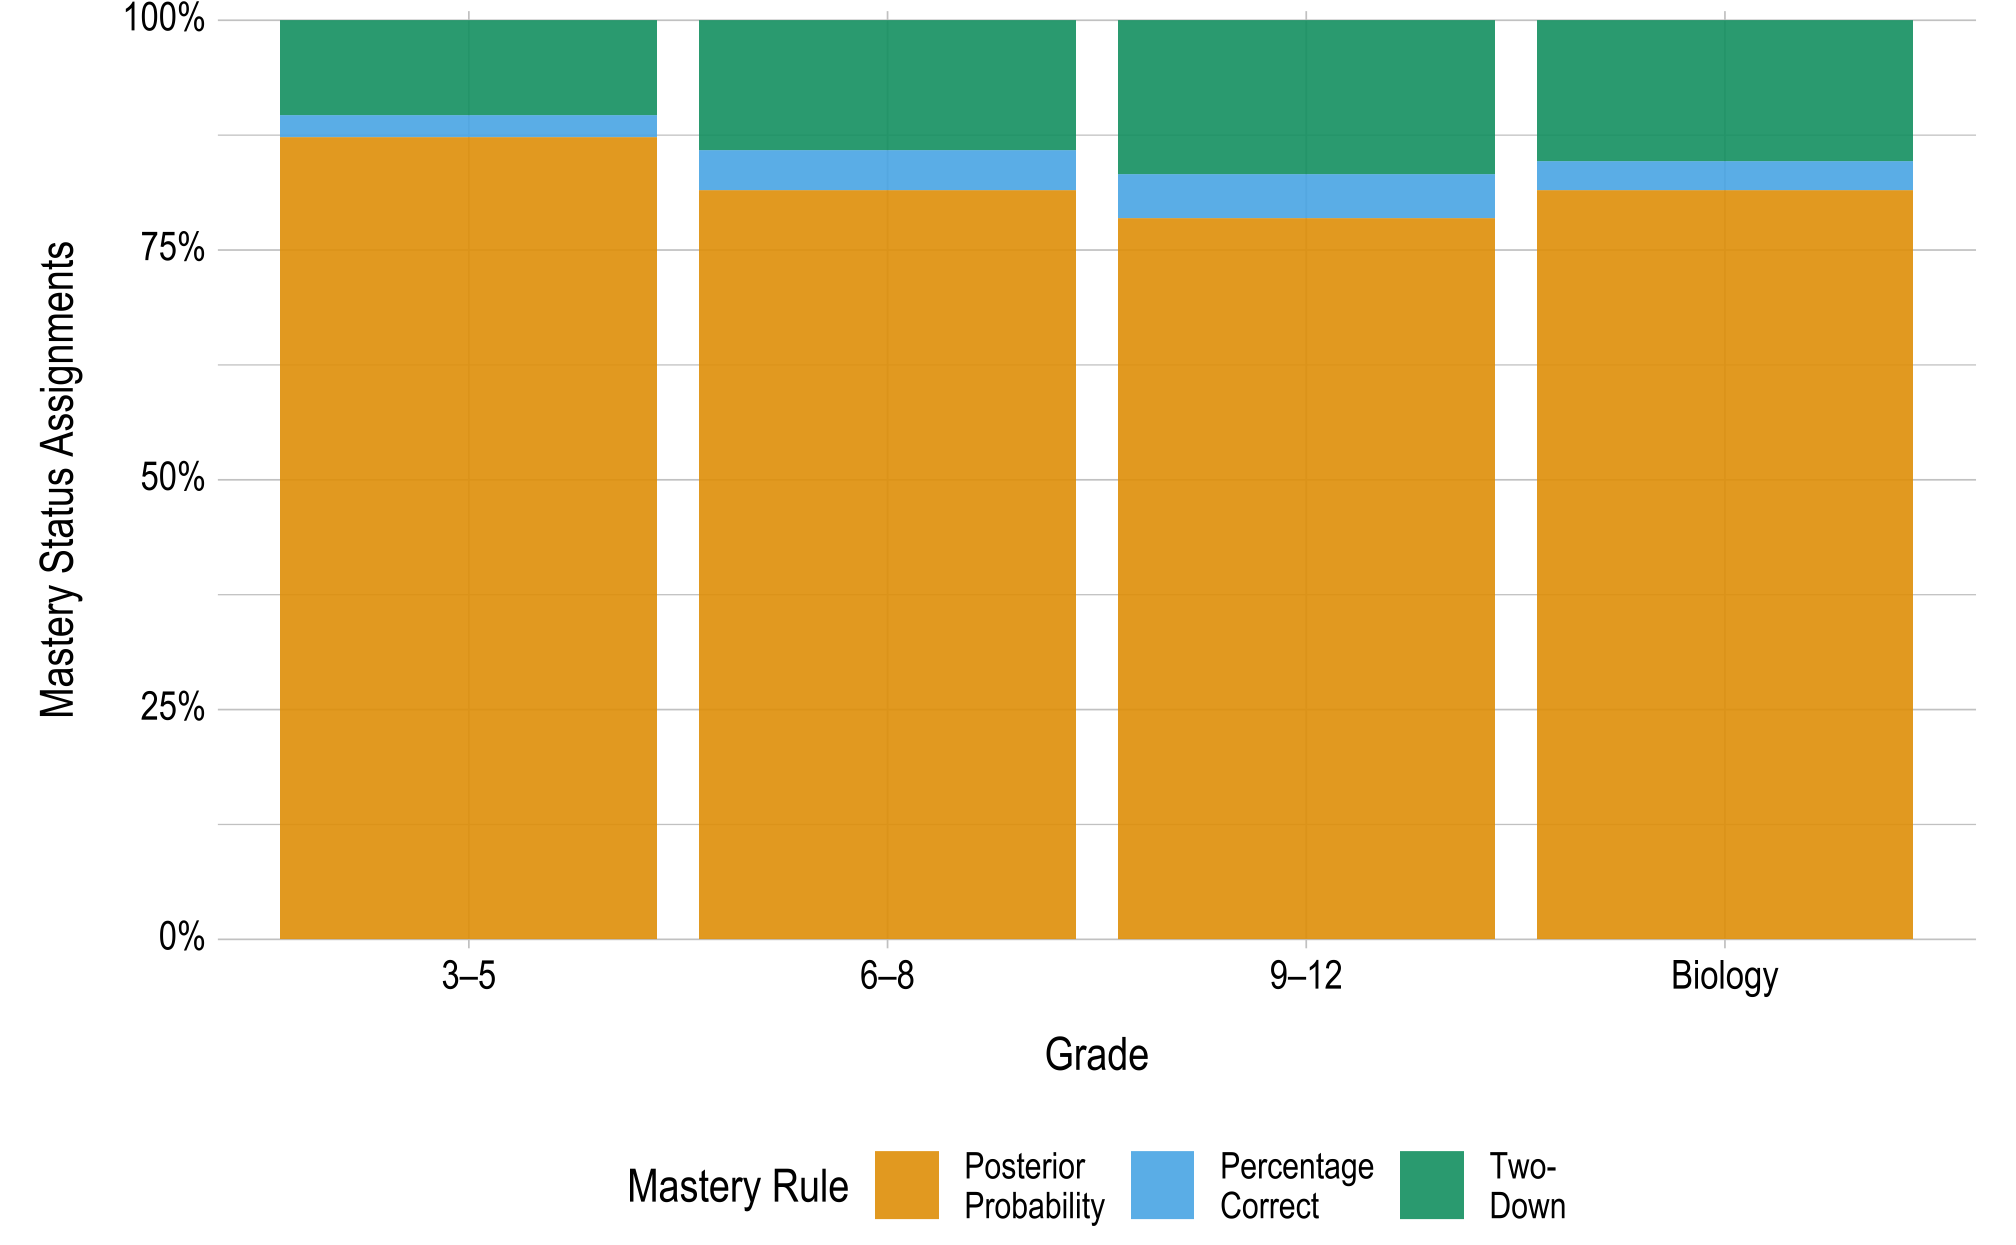
To evaluate the degree to which each mastery assignment rule contributed to students’ linkage level mastery status during the 2021–2022 administration of DLM assessments, the percentage of mastery statuses obtained by each scoring rule was calculated, as shown in Figure 7.1. Posterior probability was given first priority. That is, if multiple scoring rules agreed on the highest linkage level mastered within an EE (e.g., the posterior probability and 80% correct both indicate the Target linkage level as the highest mastered), the mastery status was counted as obtained via the posterior probability. If mastery was not demonstrated by meeting the posterior probability threshold, the 80% scoring rule was imposed, followed by the two-down rule. This means that EEs that were assessed by a student at the lowest two linkage levels (i.e., Initial and Precursor) are never categorized as having mastery assigned by the two-down rule. This is because the student would either master the assessed linkage level and have the EE counted under the posterior probability or 80% correct scoring rule, or all three scoring rules would agree on the score (i.e., no evidence of mastery), in which case preference is given to the posterior probability. Across grades, approximately 78%–87% of mastered linkage levels were derived from the posterior probability obtained from the modeling procedure. Approximately 2%–5% of linkage levels were assigned mastery status by the percentage correct rule. The remaining approximately 10%–17% of mastered linkage levels were determined by the minimum mastery, or two-down rule.
Because correct responses to all items measuring the linkage level are often necessary to achieve a posterior probability above the .80 threshold, the percentage correct rule overlapped considerably (but was second in priority) with the posterior probabilities. The percentage correct rule did, however, provide mastery status in those instances where correctly responding to all or most items still resulted in a posterior probability below the mastery threshold. The agreement between these two methods was quantified by examining the rate of agreement between the highest linkage level mastered for each EE for each student. For the 2021–2022 operational year, the rate of agreement between the two methods was 84%. However, in instances in which the two methods disagreed, the posterior probability method indicated a higher level of mastery (and therefore was implemented for scoring) in 75% of cases. Thus, in some instances, the posterior probabilities allowed students to demonstrate mastery when the percentage correct was lower than 80% (e.g., a student completed a four-item testlet and answered three of four items correctly).
Figure 7.1: Linkage Level Mastery Assignment by Mastery Rule for Each Grade Band or Course
7.3.2 Linkage Level Mastery
Scoring for DLM assessments determines the highest linkage level mastered for each EE. The linkage levels are (in order): Initial, Precursor, and Target. A student can be a master of zero, one, two, or all three linkage levels, within the order constraints. For example, if a student masters the Precursor level, they also master the Initial linkage level. This section summarizes the distribution of students by highest linkage level mastered across all EEs. For each student, the highest linkage level mastered across all tested EEs was calculated. Then, for each grade, the number of students with each linkage level as their highest mastered linkage level across all EEs was summed and then divided by the total number of students who tested in the grade. This resulted in the proportion of students for whom each level was the highest linkage level mastered.
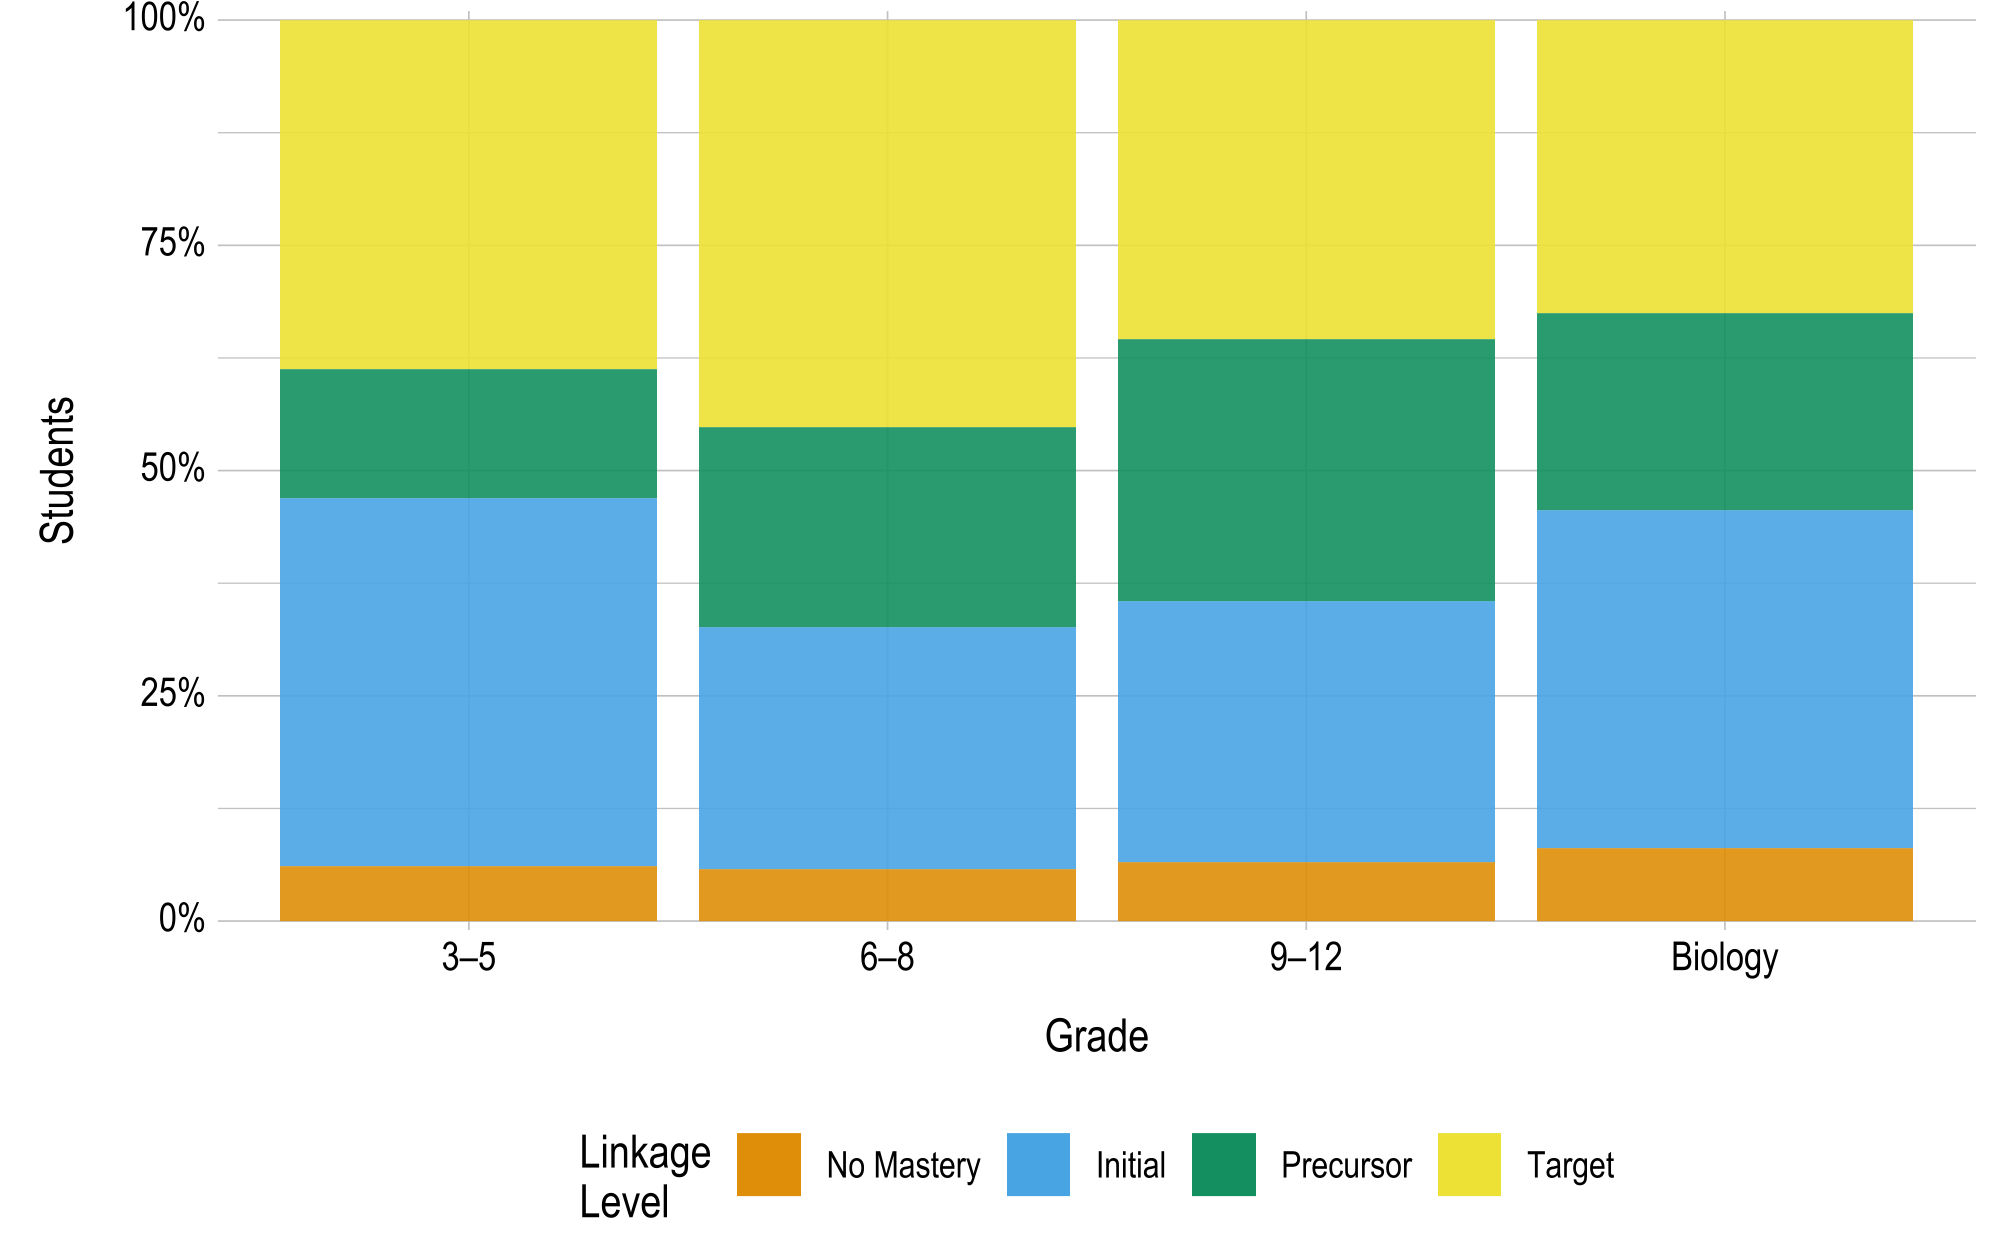
Figure 7.2 displays the percentage of students who mastered each linkage level as the highest linkage level across all assessed EEs in science. For example, across all 3-5 science EEs, the Initial level was the highest level that students mastered 41% of the time. The percentage of students who mastered as high as the Target linkage level ranged from approximately 33% to 45%.
Figure 7.2: Students’ Highest Linkage Level Mastered Across Science Essential Elements by Grade
7.4 Data Files
DLM assessment results were made available to DLM state education agencies following the spring 2022 administration. Similar to prior years, the General Research File (GRF) contained student results, including each student’s highest linkage level mastered for each EE and final performance level for science for all students who completed any testlets. In addition to the GRF, the states received several supplemental files. Consistent with prior years, the special circumstances file provided information about which students and EEs were affected by extenuating circumstances (e.g., chronic absences), as defined by each state. State education agencies also received a supplemental file to identify exited students. The exited students file included all students who exited at any point during the academic year. In the event of observed incidents during assessment delivery, state education agencies are provided with an incident file describing students impacted; however, no incidents occurred during 2021–2022.
Consistent with prior delivery cycles, state education agencies were provided with a 2-week window following data file delivery to review the files and invalidate student records in the GRF. Decisions about whether to invalidate student records are informed by individual state policy. If changes were made to the GRF, state education agencies submitted final GRFs via Educator Portal. The final GRF was used to generate score reports.
7.5 Score Reports
Assessment results were provided to state education agencies to report to parents/guardians, educators, and local education agencies. Individual Student Score Reports summarized student performance on the assessment. Several aggregated reports were provided to state and local education agencies, including reports for the classroom, school, district, and state. No changes were made to the structure of aggregated reports during spring 2022. One change to the Individual Student Score Reports is summarized below. For a complete description of score reports, including aggregated reports, see Chapter 7 of the 2015–2016 Technical Manual—Science (Dynamic Learning Maps Consortium, 2017).
7.5.1 Individual Student Score Reports
Because of continued impacts of the COVID-19 pandemic on instruction and assessment, during 2021–2022, state education agencies were given the option to add a cautionary statement to Individual Student Score Reports, which indicated that the results may reflect the continued effects of the COVID-19 pandemic on student performance. Four states opted to include the cautionary statement on their individual score reports.
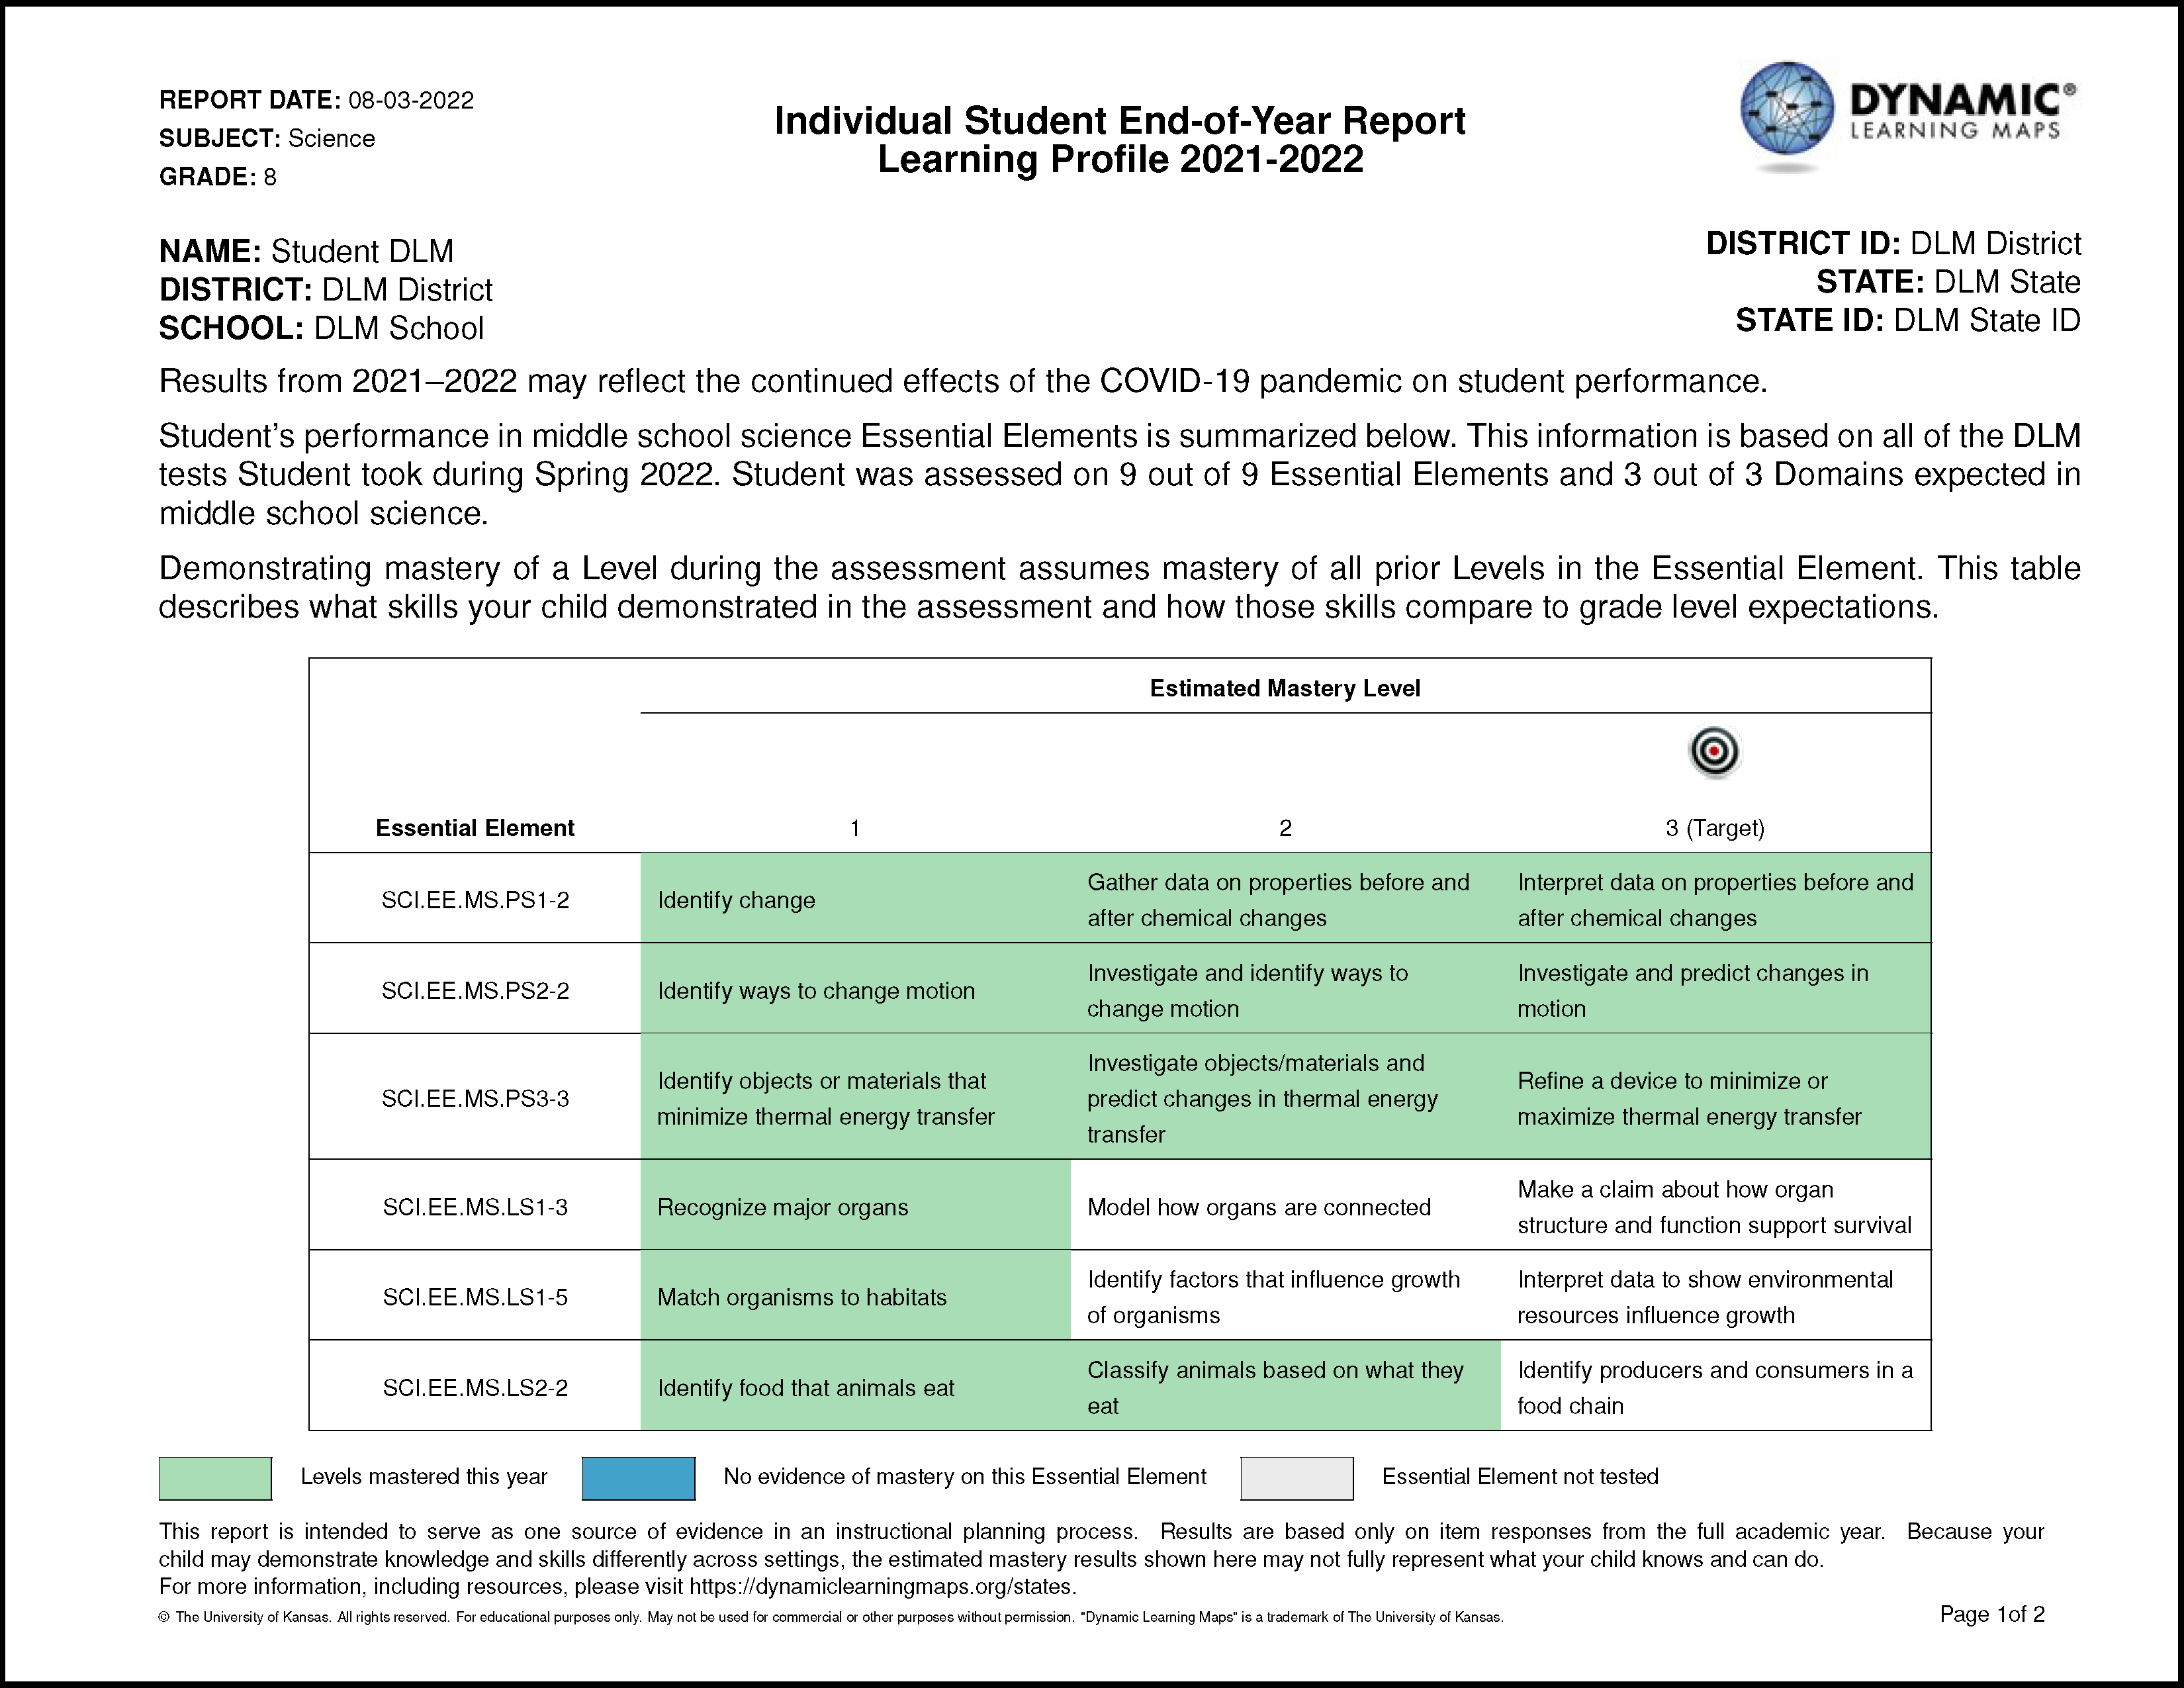
A sample Performance Profile and a sample Learning Profile reflecting the optional cautionary statement are provided in Figure 7.3 and Figure 7.4.
Figure 7.3: Example Page of the Performance Profile With Cautionary Statement for 2021–2022.
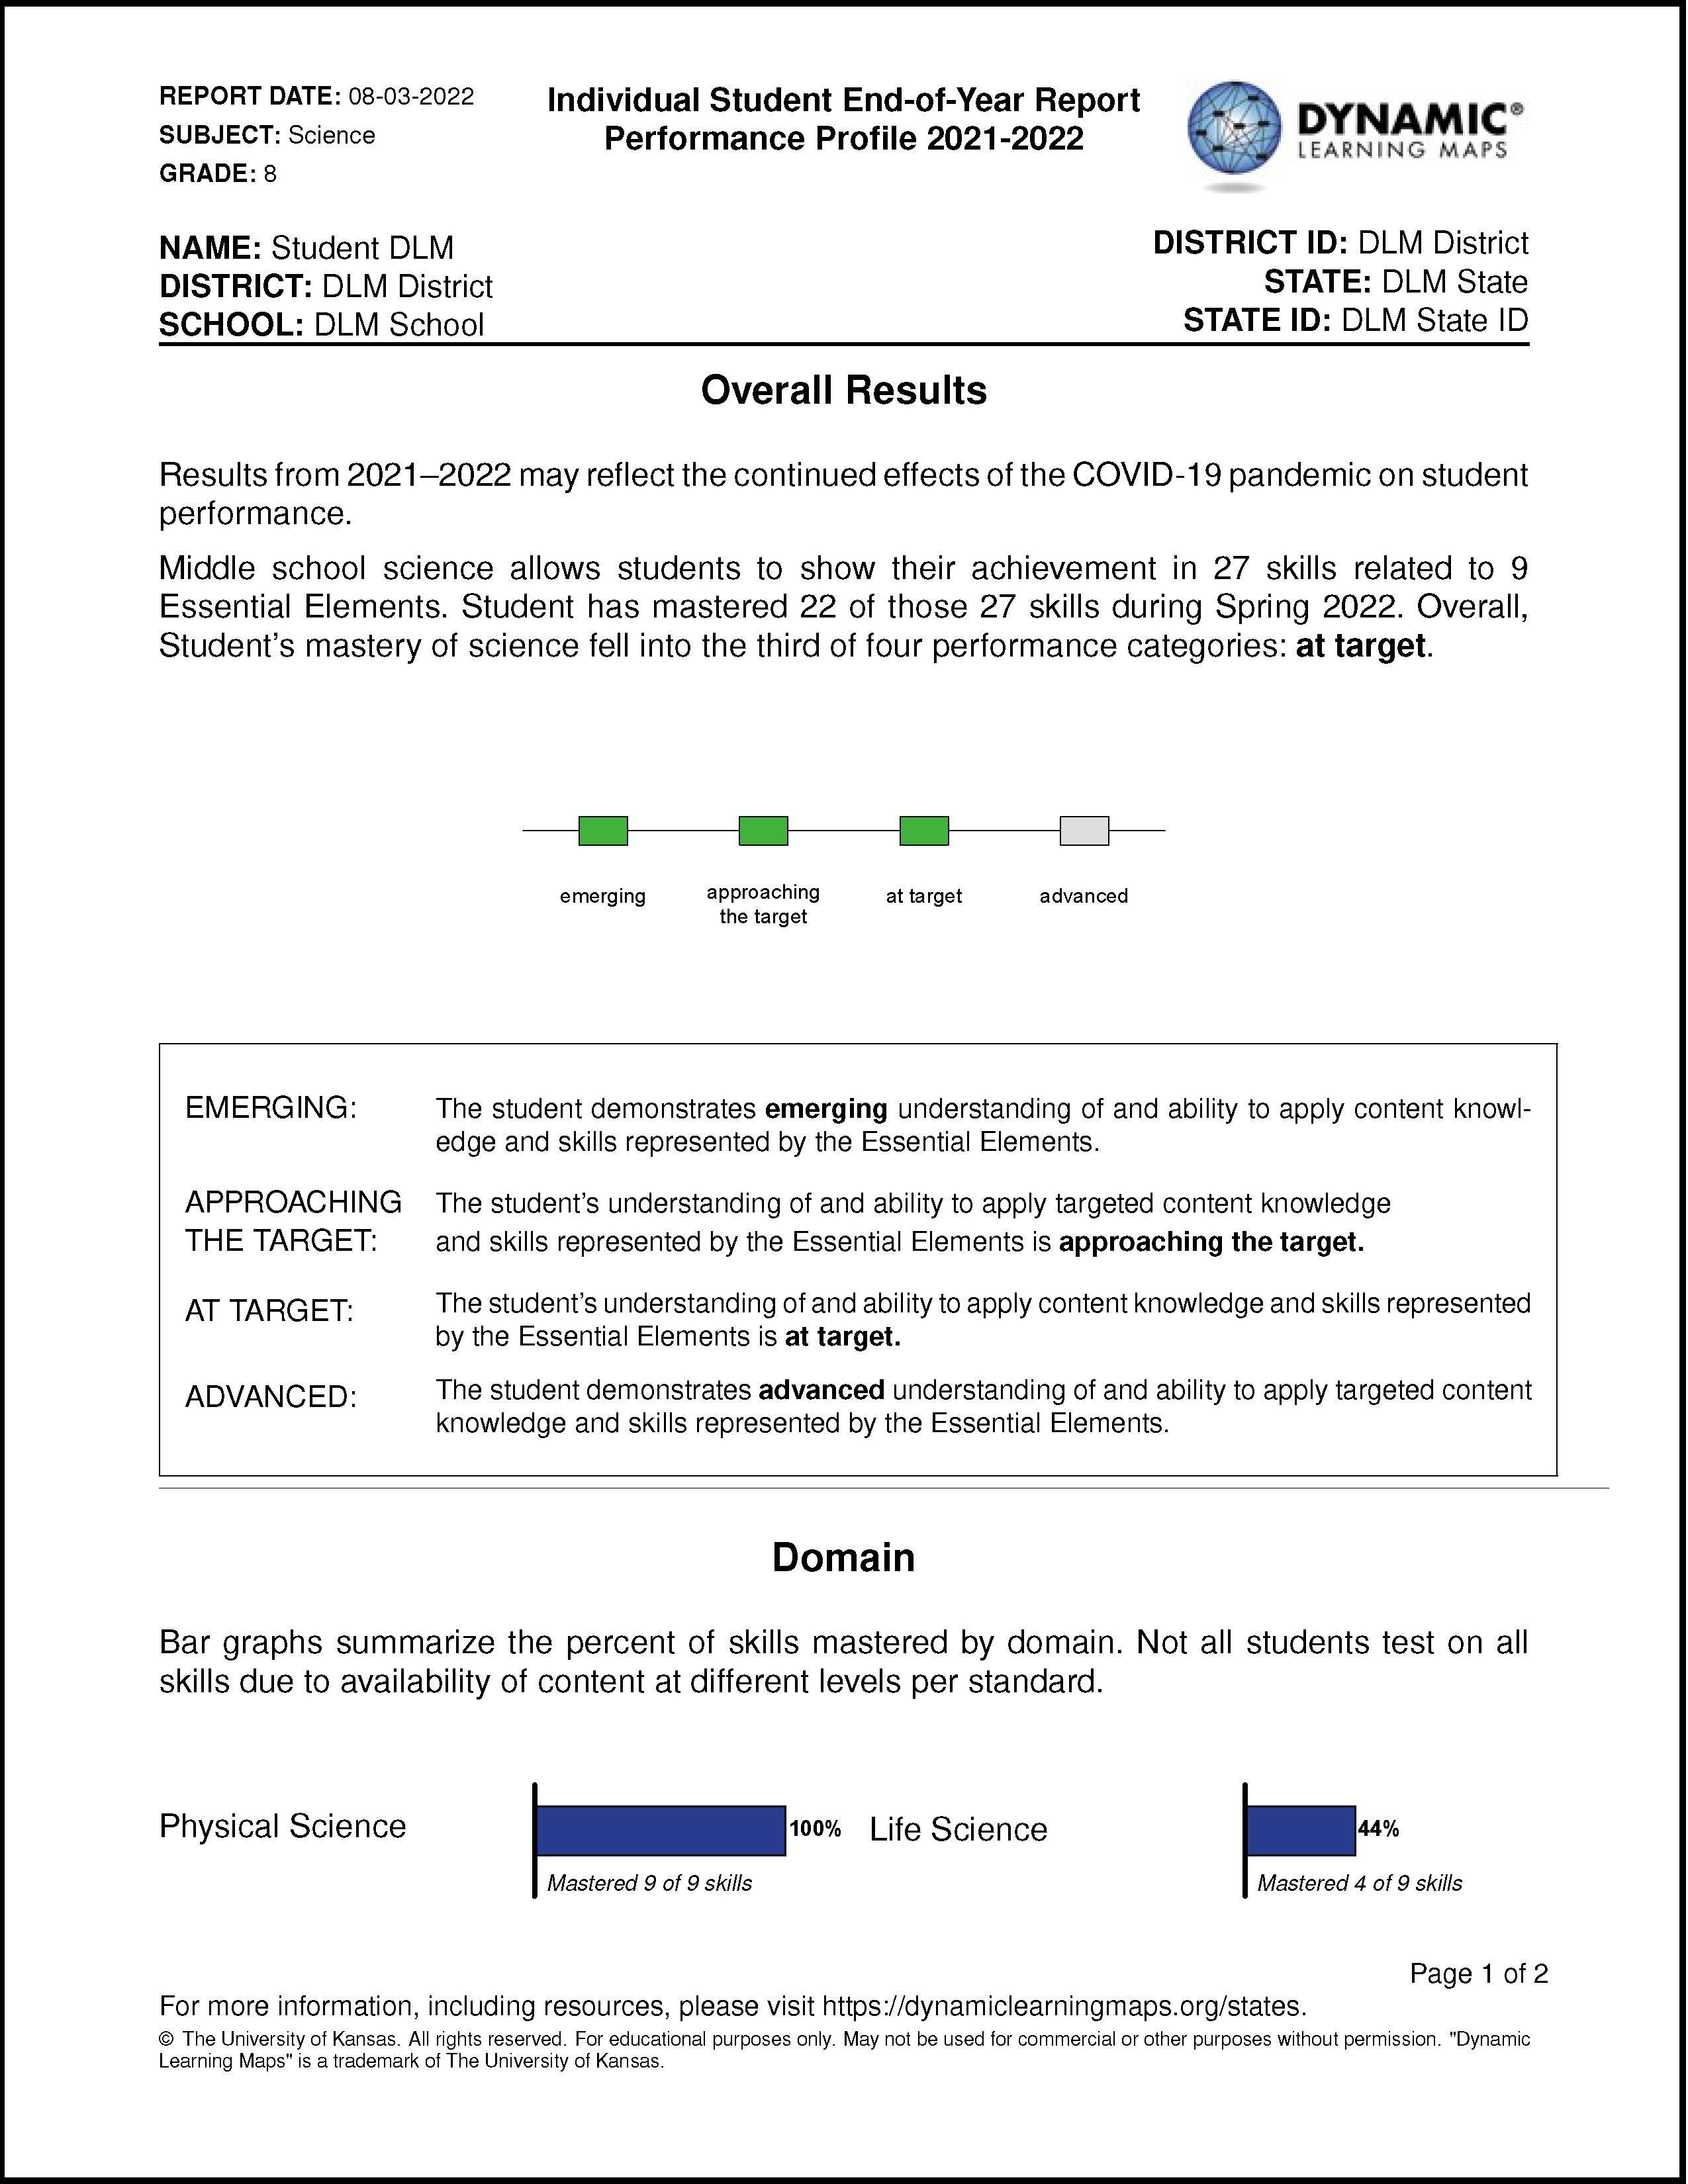
Figure 7.4: Example Page of the Learning Profile With Cautionary Statement for 2021–2022.
7.6 Quality-Control Procedures for Data Files and Score Reports
Changes to the quality-control procedures were made only to the extent of accommodating the revised score reports for 2021–2022 (i.e., checking to be sure the cautionary statement was correctly applied for states who opted to include it on score reports). For a complete description of quality-control procedures, see Chapter 7 of the 2015–2016 Technical Manual—Science (Dynamic Learning Maps Consortium, 2017).
7.7 Conclusion
Results for DLM assessments include students’ overall performance levels and linkage level mastery decisions for each assessed EE and linkage level. During spring 2022, assessments were administered to 44,375 students in 20 states. Between 10% and 22% of students achieved at the At Target or Advanced levels across all grades. Of the three scoring rules, linkage level mastery status was most frequently assigned by the diagnostic classification model.
Following the spring 2022 administration, three data files were delivered to state education agencies: GRF, special circumstance code file, and exited students file. Lastly, state education agencies could opt to include cautionary text to score reports to aid in interpretation.