4 Assessment Delivery
Chapter 4 of the Dynamic Learning Maps® (DLM®) Alternate Assessment System 2015–2016 Technical Manual—Science (Dynamic Learning Maps Consortium, 2017) describes general test administration and monitoring procedures. This chapter describes updated procedures and data collected in 2021–2022, including a summary of administration time, adaptive routing, Personal Needs and Preferences Profile selections, and test administrator survey responses regarding user experience.
Overall, administration features remained consistent with the 2020–2021 intended implementation, including the availability of instructionally embedded testlets, spring operational administration of testlets, the use of adaptive delivery during the spring window, and the availability of accessibility supports.
For a complete description of test administration for DLM assessments, including information on available resources and materials and information on monitoring assessment administration, see the 2015–2016 Technical Manual—Science (Dynamic Learning Maps Consortium, 2017).
4.1 Key Features of the Science Assessment Model
This section describes DLM test administration for 2021–2022. For a complete description of key administration features, including information on assessment delivery, the Kite Suite®, and linkage level assignment, see Chapter 4 of the 2015–2016 Technical Manual—Science (Dynamic Learning Maps Consortium, 2017). Additional information about changes in administration can also be found in the Test Administration Manual (DLM Consortium, 2021) and the Educator Portal User Guide (Dynamic Learning Maps Consortium, 2021c).
4.1.1 Assessment Administration Windows
Assessments are administered in the spring assessment window for operational reporting. Optional assessments are available during the instructionally embedded assessment window for educators to administer for formative information. Additional descriptions of how Essential Elements (EEs) and linkage levels are assigned during the spring assessment window can be found in the Adaptive Delivery section later in this chapter.
4.1.1.1 Instructionally Embedded Assessment Window
During the instructionally embedded assessment window, testlets are optionally available for test administrators to assign to their students. When choosing to administer the optional testlets during the instructionally embedded assessment window, educators decide which EEs and linkage levels to assess for each student. The assessment delivery system recommends a linkage level for each EE based on the educator’s responses to the student’s First Contact survey, but educators can choose a different linkage level based on their own professional judgment. The dates for the instructionally embedded assessment window are determined by which assessment model each state participates in for English language arts (ELA) and mathematics (i.e., Instructionally Embedded or Year-End). States that only participate in the science assessments follow the dates for the Year-End model. In 2021–2022, the instructionally embedded assessment window occurred between September 13, 2021, and February 23, 2022, for states who participate in the Year-End model and between September 13, 2021, and December 17, 2021, for states who participate in the Instructionally Embedded model. States were given the option of using the entire window or setting their own dates within the larger window. Across all states, the instructionally embedded assessment window ranged from 4–23 weeks.
4.1.1.2 Spring Assessment Window
During the spring assessment window, students are assessed on all of the EEs on the assessment blueprint in science. The linkage level for each EE is determined by the system. As with the instructionally embedded assessment window, dates for the spring assessment window are determined by which assessment model is used for ELA and mathematics. In 2021–2022, the spring assessment window occurred between March 14, 2022, and June 10, 2022, for states who participate in the Year-End model and between February 7, 2022, and May 20, 2022, for states who participate in the Instructionally Embedded model. States were given the option of using the entire window or setting their own dates within the larger window. Across all states, the spring assessment window ranged from 6–15 weeks.
4.2 Evidence from the DLM System
This section describes evidence collected by the DLM System during the 2021–2022 operational administration of the DLM alternate assessment. The categories of evidence include data relating to administration time, device usage, adaptive routing, and accessibility support selections.
4.2.1 Administration Time
Estimated administration time varies by student and subject. Testlets can be administered separately across multiple testing sessions as long as they are all completed within the testing window.
The published estimated total testing time per testlet is around 5–15 minutes. The estimated total testing time is 45–135 minutes per student in the spring assessment window. Published estimates are slightly longer than anticipated real testing times because of the assumption that test administrators need time for setup. Actual testing time per testlet varies depending on each student’s unique characteristics.
Kite Student Portal captured start dates, end dates, and time stamps for every testlet. The difference between these start and end times was calculated for each completed testlet. Table 4.1 summarizes the distribution of test times per testlet. The distribution of test times in Table 4.1 is consistent with the distribution observed in prior years. Most testlets took around three minutes or less to complete. Time per testlet may have been impacted by student breaks during the assessment. Testlets with shorter than expected administration times are included in an extract made available to each state. States can use this information to monitor assessment administration and address as necessary. For a description of the administration time monitoring extract, see section 4.3.2 of this chapter.
| Grade | Min | Median | Mean | Max | 25Q | 75Q | IQR |
|---|---|---|---|---|---|---|---|
| Elementary | .017 | 2.17 | 2.99 | 90.00 | 1.33 | 3.50 | 2.17 |
| Middle school | .067 | 1.95 | 2.71 | 89.67 | 1.18 | 3.17 | 1.98 |
| High school | .117 | 2.17 | 2.97 | 89.78 | 1.32 | 3.45 | 2.13 |
| Biology | .117 | 2.13 | 2.84 | 88.85 | 1.33 | 3.38 | 2.05 |
| Note. Min = minimum, Max = maximum, 25Q = lower quartile, 75Q = upper quartile, IQR = interquartile range. |
4.2.2 Device Usage
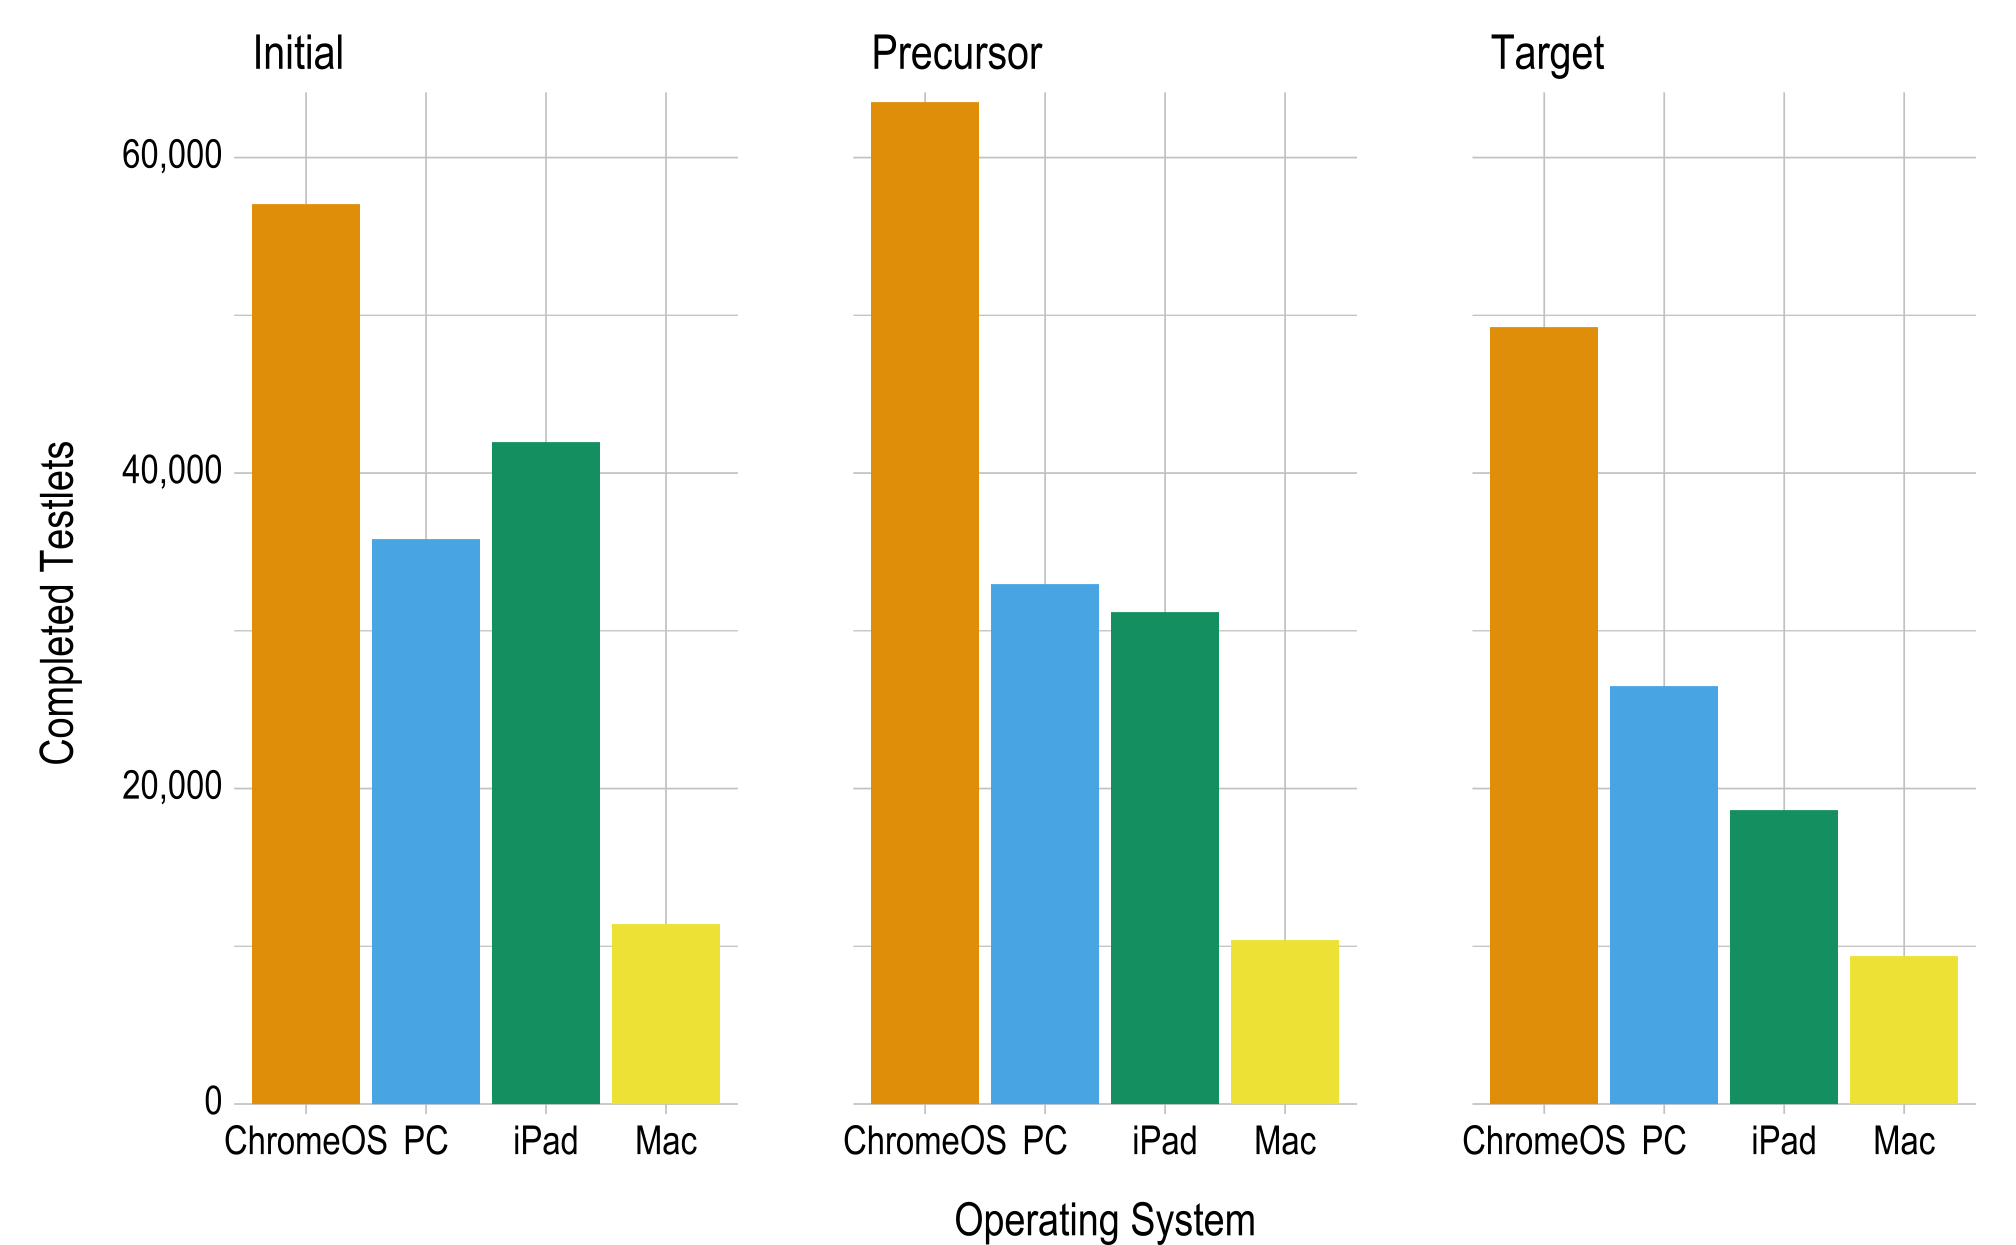
Testlets may be administered on a variety of devices. Kite Student Portal captured the operating system used for each testlet completed. Although these data do not capture specific devices used to complete each testlet (e.g., SMART Board, switch system, etc.), they provide high-level information about how students access assessment content. For example, we can identify how often an iPad is used relative to a Chromebook or traditional PC. Figure 4.1 shows the number of testlets completed on each operating system by subject and linkage level for 2021–2022. Overall, 44% of testlets were completed on a Chromebook, 25% were completed on a PC, 24% were completed on an iPad, and 8% were completed on a Mac.
Figure 4.1: Distribution of Devices Used for Completed Testlets
4.2.3 Blueprint Coverage
Each student is assessed on all EEs included on the assessment blueprint. For a description of the assessment blueprints see Chapter 3 of the 2015–2016 Technical Manual—Science (Dynamic Learning Maps Consortium, 2017). Table 4.2 summarizes the number of EEs required for each grade or course.
| Grade or Course | n |
|---|---|
| Elementary | 9 |
| Middle school | 9 |
| High school | 9 |
| Biology | 10 |
Across all grades, 94% of students were assessed on all of the EEs and met blueprint requirements. Table 4.3 summarizes the total number of students and the percentage of students meeting blueprint requirements based on their complexity band. When comparing complexity band distributions, there was a slightly lower percentage of Foundational students not meeting requirements. However, all complexity band groups had over 91% of students meeting the coverage requirements.
| Complexity Band | n | % meeting requirements |
|---|---|---|
| Foundational | 6,986 | 91.2 |
| Band 1 | 18,000 | 94.0 |
| Band 2 | 13,573 | 94.8 |
| Band 3 | 5,816 | 94.9 |
4.2.4 Adaptive Delivery
During the spring 2022 test administration, the science assessments were adaptive between testlets, following the same routing rules applied in prior years. That is, the linkage level associated with the next testlet a student received was based on the student’s performance on the most recently administered testlet, with the specific goal of maximizing the match of student knowledge and skill to the appropriate linkage level content.
- The system adapted up one linkage level if the student responded correctly to at least 80% of the items measuring the previously tested EE. If the previous testlet was at the highest linkage level (i.e., Target), the student remained at that level.
- The system adapted down one linkage level if the student responded correctly to less than 35% of the items measuring the previously tested EE. If the previous testlet was at the lowest linkage level (i.e., Initial), the student remained at that level.
- Testlets remained at the same linkage level if the student responded correctly to between 35% and 80% of the items on the previously tested EE.
The linkage level of the first testlet assigned to a student was based on First Contact survey responses. The correspondence between the First Contact complexity bands and first assigned linkage levels are shown in Table 4.4.
| First Contact complexity band | Linkage level |
|---|---|
| Foundational | Initial |
| Band 1 | Initial |
| Band 2 | Precursor |
| Band 3 | Target |
Following the spring 2022 administration, analyses were conducted to determine the mean percentage of testlets that adapted from the first to second testlet administered for students within a grade or course and complexity band. The aggregated results can be seen in Table 4.5.
Due to small sample size, data regarding the adaptation of linkage levels was unavailable for Band 3 in grade 3. For the majority of students across all grades who were assigned to the Foundational Complexity Band by the First Contact survey, testlets did not adapt to a higher linkage level after the first assigned testlet (ranging from 57% to 71%). A similar pattern was seen for students assigned to Band 3, with the majority of students not adapting down to a lower linkage level after the first assigned testlet (ranging from 61% to 81%). In contrast, students assigned to Band 1 tend to adapt up to a higher linkage level after their first testlet (ranging from 54% to 74%). Consistent patterns were not as apparent for students who were assigned to Band 2. Results indicate that linkage levels of students assigned to higher complexity bands are more variable with respect to the direction in which students move between the first and second testlets. However, this finding of more variability in the higher complexity bands is consistent with prior years, which showed the same trend. Several factors may help explain these results, including more variability in student characteristics within this group and content-based differences across grades. For a description of previous findings, see Chapter 4 of the 2015–2016 Technical Manual—Science (Dynamic Learning Maps Consortium, 2017) and the subsequent technical manual updates (Dynamic Learning Maps Consortium, 2018a, 2018b, 2019, 2021a).
|
Foundational
|
Band 1
|
Band 2
|
Band 3
|
||||||
|---|---|---|---|---|---|---|---|---|---|
| Grade | Adapted up (%) | Did not adapt (%) | Adapted up (%) | Did not adapt (%) | Adapted up (%) | Did not adapt (%) | Adapted down (%) | Did not adapt (%) | Adapted down (%) |
| Grade 3 | 39.9 | 60.1 | 68.1 | 31.9 | 22.5 | 46.7 | 30.8 | * | * |
| Grade 4 | 43.0 | 57.0 | 73.3 | 26.7 | 25.2 | 46.3 | 28.5 | 63.1 | 36.9 |
| Grade 5 | 40.3 | 59.7 | 73.7 | 26.3 | 27.5 | 43.2 | 29.4 | 64.8 | 35.2 |
| Grade 6 | 32.7 | 67.3 | 70.8 | 29.2 | 32.9 | 40.0 | 27.1 | 61.0 | 39.0 |
| Grade 7 | 34.2 | 65.8 | 73.1 | 26.9 | 34.8 | 38.8 | 26.4 | 61.6 | 38.4 |
| Grade 8 | 38.8 | 61.2 | 71.1 | 28.9 | 38.3 | 41.7 | 20.0 | 67.0 | 33.0 |
| Grade 9 | 33.8 | 66.2 | 60.7 | 39.3 | 45.7 | 38.7 | 15.5 | 80.6 | 19.4 |
| Grade 10 | 29.0 | 71.0 | 61.3 | 38.7 | 40.1 | 40.9 | 19.0 | 80.7 | 19.3 |
| Grade 11 | 32.9 | 67.1 | 57.0 | 43.0 | 40.9 | 40.7 | 18.5 | 78.8 | 21.2 |
| Grade 12 | 29.3 | 70.7 | 54.0 | 46.0 | 37.7 | 40.2 | 22.1 | 74.2 | 25.8 |
| Biology | 32.9 | 67.1 | 54.1 | 45.9 | 20.5 | 43.1 | 36.4 | 62.8 | 37.2 |
| Note. Foundational and Band 1 correspond to the testlets at the lowest linkage level, so testlets could not adapt down a linkage level. Band 3 corresponds to testlets at the highest linkage level in science, so testlets could not adapt up a linkage level. | |||||||||
| * These data were suppressed because n < 50. | |||||||||
After the second testlet is administered, testlets continue to adapt based on the same routing rules. Table 4.6 shows the total number and percentage of testlets that were assigned at each linkage level during the spring assessment window. Testlets were fairly evenly distributed across the three linkage levels, with the Initial and Precursor linkage levels being assigned slightly more often.
| Linkage level | n | % |
|---|---|---|
| Initial | 146,235 | 37.7 |
| Precursor | 138,060 | 35.6 |
| Target | 103,795 | 26.7 |
4.2.5 Administration Incidents
DLM staff annually evaluates testlet assignment to ensure students are correctly assigned to testlets. Administration incidents that have the potential to affect scoring are reported to state education agencies in a supplemental Incident File. No incidents were observed during the 2021–2022 operational assessment windows. Assignment of testlets will continue to be monitored in subsequent years to track any potential incidents and report them to state education agencies.
4.2.6 Accessibility Support Selections
Accessibility supports provided in 2021–2022 were the same as those available in previous years. The DLM Accessibility Manual (Dynamic Learning Maps Consortium, 2021b) distinguishes accessibility supports that are provided in Kite Student Portal via the Personal Needs and Preferences Profile, require additional tools or materials, or are provided by the test administrator outside the system. Table 4.7 shows selection rates for the three categories of accessibility supports. Overall, 43,870 students (90%) had at least one support selected. The most commonly selected supports in 2021–2022 were human read aloud, spoken audio, and test administrator enters responses for student. For a complete description of the available accessibility supports, see Chapter 4 of the 2015–2016 Technical Manual—Science (Dynamic Learning Maps Consortium, 2017). Additionally, educators reported in the First Contact survey that 42% of students were able to access a computer independently, with or without assistive technology.
| Support | n | % |
|---|---|---|
| Supports provided in Kite Student Portal | ||
| Spoken audio | 27,324 | 56.1 |
| Magnification | 7,186 | 14.8 |
| Color contrast | 4,507 | 9.3 |
| Overlay color | 2,141 | 4.4 |
| Invert color choice | 1,433 | 2.9 |
| Supports requiring additional tools/materials | ||
| Individualized manipulatives | 20,474 | 42.1 |
| Calculator | 16,007 | 32.9 |
| Single-switch system | 2,042 | 4.2 |
| Alternate form - visual impairment | 1,201 | 2.5 |
| Two-switch system | 638 | 1.3 |
| Uncontracted braille | 59 | 0.1 |
| Supports provided outside the system | ||
| Human read aloud | 38,757 | 79.6 |
| Test administrator enters responses for student | 26,590 | 54.6 |
| Partner-assisted scanning | 4,025 | 8.3 |
| Language translation of text | 766 | 1.6 |
| Sign interpretation of text | 680 | 1.4 |
4.3 Evidence From Monitoring Assessment Administration
Monitoring of assessment administration was conducted using various materials and strategies. DLM project staff developed an assessment administration monitoring protocol for use by DLM staff, state education agency staff, and local education agency staff. Project staff also reviewed Service Desk contacts and hosted regular check-in calls to monitor common issues and concerns during the assessment window. This section provides an overview of all resources and supports as well as more detail regarding the assessment administration observation protocol and its use, check-in calls with states, and methods for monitoring testlet delivery.
4.3.1 Test Administration Observations
DLM project staff developed an assessment administration observation protocol to standardize data collection across observers and locations. This assessment administration protocol is available for use by state and local education agencies; however, participation in the test administration observations is not required. The majority of items in the protocol are based on direct recording of what is observed and require little inference or background knowledge. Information from the protocol is used to evaluate several assumptions in the validity argument, addressed in the Test Administration Observation Results section of this chapter.
One observation form is completed per testlet administered. Some items are differentiated for computer-delivered and educator-administered testlets. The four main sections include Preparation/Set Up, Administration, Accessibility, and Observer Evaluation. The Preparation/Set Up section includes documentation of the testing location, testing conditions, the testing device used for the testing session, and documentation of the test administrator’s preparation for the session. The Administration section is provided for the documentation of the student’s response mode, general test administrator behaviors during the session, subject-specific test administrator behaviors, any technical problems experienced with the Kite Suite, and documentation of student completion of the testlet. The Accessibility section focuses on the use of accessibility features, any difficulty the student encountered with the accessibility features, and any additional devices the student uses during the testing session. Finally, Observer Evaluation requires that the observer rate overall student engagement during the session and provide any additional relevant comments.
The protocol is available as an online survey (optimized for mobile devices and with branching logic) administered through Kite Survey Solutions, a survey platform within the Kite Suite.
Training resources are provided to state education agency staff to support fidelity of use of the assessment administration protocol and increase the reliability of data collected (see Table 4.8). State education agency staff have access to the Test Administration Observation Training video on the use of the Test Administration Observation Protocol. The links to this video, the Guidance for Local Observers, and the Test Administrator Observation Protocol are provided on the state side of the DLM website, and state education agencies are encouraged to use this information in their state monitoring efforts. State education agencies are able to use these training resources to encourage use of the protocol among local education agency staff. States are also cautioned that the protocol is only to be used to document observations for the purpose of describing the administration process. It is not to be used for evaluating or coaching test administrators or gauging student academic performance. This caution, as well as general instructions for completing and submitting the protocol, are provided in the form itself.
| Resource | Description |
|---|---|
| DLM Test Administration Observation Research Protocol (PDF) | Provides observers with a standardized way to describe the assessment administration. |
| Guide to Test Administration Observations: Guidance for Local Observers (PDF) | Provides observers with the purpose and use of the observation protocol as well as general instructions for use. |
| Test Administration Observation Training Video (Vimeo video) | Provides training on the use of the Test Administration Observation Protocol. |
During 2021–2022, there were 48 assessment administration observations collected in six states. Table 4.9 shows the number of observations collected by state. Of the observations, 32 (67%) were of computer-delivered assessments and 16 (33%) were of educator-administered testlets.
| State | n | % |
|---|---|---|
| Arkansas | 36 | 75.0 |
| Missouri | 2 | 4.2 |
| West Virginia | 10 | 20.8 |
To investigate the assumptions that underlie the claims of the validity argument, several parts of the test administration observation protocol were designed to provide information corresponding to the assumptions. One assumption addressed is that educators allow students to engage with the system as independently as they are able. For computer-delivered testlets, related evidence is summarized in Table 4.10; behaviors were identified as supporting, neutral, or nonsupporting. For example, clarifying directions (62.5% of observations) removes student confusion about the task demands as a source of construct-irrelevant variance and supports the student’s meaningful, construct-related engagement with the item. In contrast, using physical prompts (e.g., hand-over-hand guidance) indicates that the test administrator directly influenced the student’s answer choice. Overall, 74% of observed behaviors were classified as supporting, with 1% of observed behaviors reflecting nonsupporting actions.
| Action | n | % |
|---|---|---|
| Supporting | ||
| Clarified directions or expectations for the student | 20 | 62.5 |
| Read one or more screens aloud to the student | 16 | 50.0 |
| Navigated one or more screens for the student | 12 | 37.5 |
| Repeated question(s) before student responded | 7 | 21.9 |
| Neutral | ||
| Used pointing or gestures to direct student attention or engagement | 6 | 18.8 |
| Used materials or manipulatives during the administration process | 4 | 12.5 |
| Used verbal prompts to direct the student’s attention or engagement (e.g., “look at this.”) | 4 | 12.5 |
| Asked the student to clarify or confirm one or more responses | 2 | 6.2 |
| Allowed student to take a break during the testlet | 1 | 3.1 |
| Entered one or more responses for the student | 1 | 3.1 |
| Repeated question(s) after student responded (gave a second trial at the same item) | 0 | 0.0 |
| Nonsupporting | ||
| Physically guided the student to a response | 1 | 3.1 |
| Reduced the number of answer choices available to the student | 0 | 0.0 |
| Note. Respondents could select multiple responses to this question. | ||
For DLM assessments, interaction with the system includes interaction with the assessment content as well as physical access to the testing device and platform. The fact that educators navigated one or more screens in 38% of the observations does not necessarily indicate the student was prevented from engaging with the assessment content as independently as possible. Depending on the student, test administrator navigation may either support or minimize students’ independent, physical interaction with the assessment system. While not the same as interfering with students’ interaction with the content of the assessment, navigating for students who are able to do so independently conflicts with the assumption that students are able to interact with the system as intended. The observation protocol did not capture why the test administrator chose to navigate, and the reason was not always obvious.
A related assumption is that students are able to interact with the system as intended. Evidence for this assumption was gathered by observing students taking computer-delivered testlets, as shown in Table 4.11. Independent response selection was observed in 56% of the cases. Non-independent response selection may include allowable practices, such as test administrators entering responses for the student. The use of materials outside of Kite Student Portal was seen in 3% of the observations. Verbal prompts for navigation and response selection are strategies within the realm of allowable flexibility during test administration. These strategies, which are commonly used during direct instruction for students with the most significant cognitive disabilities, are used to maximize student engagement with the system and promote the type of student-item interaction needed for a construct-relevant response. However, they also indicate that students were not able to sustain independent interaction with the system throughout the entire testlet.
| Action | n | % |
|---|---|---|
| Selected answers independently | 18 | 56.2 |
| Navigated screens independently | 15 | 46.9 |
| Selected answers after verbal prompts | 10 | 31.2 |
| Navigated screens after verbal prompts | 8 | 25.0 |
| Navigated screens after test administrator pointed or gestured | 3 | 9.4 |
| Skipped one or more items | 3 | 9.4 |
| Asked the test administrator a question | 2 | 6.2 |
| Independently revisited a question after answering it | 2 | 6.2 |
| Used materials outside of Kite Student Portal to indicate responses to testlet items | 1 | 3.1 |
| Revisited one or more questions after verbal prompt(s) | 0 | 0.0 |
| Note. Respondents could select multiple responses to this question. |
Another assumption in the validity argument is that students are able to respond to tasks irrespective of sensory, mobility, health, communication, or behavioral constraints. This assumption was evaluated by having observers note whether there was difficulty with accessibility supports (including lack of appropriate available supports) during observations of educator-administered testlets. Of the 16 observations of educator-administered testlets, observers noted difficulty in 1 case (6%). For computer-delivered testlets, evidence to evaluate the assumption was collected by noting students who indicated responses to items using varied response modes such as gesturing (12%) and using manipulatives or materials outside of Kite (3%). Additional evidence for this assumption was gathered by observing whether students were able to complete testlets. Of the 48 test administration observations collected, students completed the testlet in 31 cases (65%). In all instances where the testlet was not completed, no reason was provided by the observer.
Finally, the test administration observations allow for an evaluation of the assumption that test administrators enter student responses with fidelity. To record student responses with fidelity, test administrators needed to observe multiple modes of communication, such as verbal, gesture, and eye gaze. Table 4.12 summarizes students’ response modes for educator-administered testlets. The most frequently observed behavior was gestured to indicate response to test administrator who selected answers.
| Response mode | n | % |
|---|---|---|
| Gestured to indicate response to test administrator who selected answers | 10 | 62.5 |
| Verbally indicated response to test administrator who selected answers | 6 | 37.5 |
| No observable response mode | 2 | 12.5 |
| Eye gaze system indication to test administrator who selected answers | 1 | 6.2 |
| Note. Respondents could select multiple responses to this question. |
Computer-delivered testlets provided another opportunity to confirm fidelity of response entry when test administrators entered responses on behalf of students. This support is recorded on the PNP Profile and is recommended for a variety of situations (e.g., students who have limited motor skills and cannot interact directly with the testing device even though they can cognitively interact with the onscreen content). Observers recorded whether the response entered by the test administrator matched the student’s response. In 1 of 32 (3%) observations of computer-delivered testlets, the test administrator entered responses on the student’s behalf. In all cases, the observers indicated that the entered response matched the student’s response.
4.3.2 Data Forensics Monitoring
Two data forensics monitoring reports are available in Educator Portal. The first report includes information about testlets completed outside of normal business hours. The second report includes information about testlets that were completed within a short period of time.
The Testing Outside of Hours report allows state education agencies to specify days and hours within a day that testlets are expected to be completed. Each state can select its own days and hours for setting expectations. For example, a state could elect to flag any testlet completed outside of Monday through Friday from 6:00 a.m. to 5:00 p.m. local time. The Testing Outside of Hours report then identifies students who completed assessments outside of the defined expected hours. Overall, 2,812 (1%) science testlets were completed outside of the expected hours by 2,411 (5%) students.
The Testing Completed in a Short Period of Time report identifies students who completed a testlet within an unexpectedly short period of time. The threshold for inclusion in the report was testlet completion time of less than 30 seconds. The report is intended for state users to identify potentially aberrant response patterns; however there are many legitimate reasons a testlet may be submitted in a short time period. Overall, 10,262 (3%) testlets were completed in a short period of time by 4,904 (11%) students.
4.4 Evidence From Test Administrators
This section first describes evidence collected from the spring 2022 test administrator survey. Data on user experience with the DLM System as well as student opportunity to learn is evaluated annually through a survey that test administrators are invited to complete after administration of the spring assessment. Test administrators receive one survey per rostered DLM student, which collects information about that student’s assessment experience. As in previous years, the survey was distributed to test administrators in Kite Student Portal, where students completed assessments. The survey consisted of four blocks. Blocks 1 and 4 were administered in every survey. Block 1 included questions about the test administrator’s perceptions of the assessments and the student’s interaction with the content, and Block 4 included questions about the test administrator’s background. Block 2 was spiraled, so test administrators received one randomly assigned section. In these sections, test administrators were asked about one of the following topics per survey: relationship to ELA instruction, relationship to mathematics instruction, or relationship to science instruction. Block 3 was added in 2021 and remained in the survey in 2022 to gather information about educational experiences during the COVID-19 pandemic.
4.4.1 User Experience With the DLM System
A total of 13,031 test administrators responded to the survey (67%) about 27,162 students’ experiences. Test administrators are instructed to respond to the survey separately for each of their students. Participating test administrators responded to surveys for a median of two students. Test administrators reported having an average of 10 years of experience in science and 11 years of experience with students with significant cognitive disabilities.
The following sections summarize responses regarding both educator and student experience with the system.
4.4.1.1 Educator Experience
Test administrators were asked to reflect on their own experience with the assessments as well as their comfort level and knowledge administering them. Most of the questions required test administrators to respond on a 4-point scale: strongly disagree, disagree, agree, or strongly agree. Responses are summarized in Table 4.13.
Nearly all test administrators (96%) agreed or strongly agreed that they were confident administering DLM testlets. Most respondents (90%) agreed or strongly agreed that the required test administrator training prepared them for their responsibilities as test administrators. Most test administrators also responded that they had access to curriculum aligned with the content that was measured by the assessments (86%) and that they used the manuals and the Educator Resources page (90%).
|
SD
|
D
|
A
|
SA
|
A+SA
|
||||||
|---|---|---|---|---|---|---|---|---|---|---|
| Statement | n | % | n | % | n | % | n | % | n | % |
| I was confident in my ability to deliver DLM testlets. | 121 | 1.4 | 248 | 3.0 | 3,458 | 41.4 | 4,520 | 54.2 | 7,978 | 95.6 |
| Required test administrator training prepared me for the responsibilities of a test administrator. | 204 | 2.5 | 632 | 7.6 | 4,187 | 50.3 | 3,301 | 39.7 | 7,488 | 90.0 |
| I have access to curriculum aligned with the content measured by DLM assessments. | 270 | 3.2 | 915 | 11.0 | 4,194 | 50.4 | 2,936 | 35.3 | 7,130 | 85.7 |
| I used manuals and/or the DLM Educator Resource Page materials. | 186 | 2.2 | 633 | 7.6 | 4,597 | 55.2 | 2,915 | 35.0 | 7,512 | 90.2 |
| Note. SD = strongly disagree; D = disagree; A = agree; SA = strongly agree; A+SA = agree and strongly agree. | ||||||||||
4.4.1.2 Student Experience
The spring 2022 test administrator survey included three items about how students responded to test items. Test administrators were asked to rate statements from strongly disagree to strongly agree. Results are presented in Table 4.14. The majority of test administrators agreed or strongly agreed that their students responded to items to the best of their knowledge, skills, and understandings; were able to respond regardless of disability, behavior, or health concerns; and had access to all necessary supports to participate.
|
SD
|
D
|
A
|
SA
|
A+SA
|
||||||
|---|---|---|---|---|---|---|---|---|---|---|
| Statement | n | % | n | % | n | % | n | % | n | % |
| Student responded to items to the best of his/her knowledge, skills, and understanding | 981 | 4.0 | 1,810 | 7.3 | 12,930 | 52.2 | 9,050 | 36.5 | 21,980 | 88.7 |
| Student was able to respond regardless of his/her disability, behavior, or health concerns | 1,532 | 6.2 | 2,088 | 8.4 | 12,588 | 50.7 | 8,623 | 34.7 | 21,211 | 85.4 |
| Student had access to all necessary supports to participate | 863 | 3.5 | 1,192 | 4.8 | 12,898 | 52.2 | 9,769 | 39.5 | 22,667 | 91.7 |
| Note. SD = strongly disagree; D = disagree; A = agree; SA = strongly agree; A+SA = agree and strongly agree. | ||||||||||
Annual survey results show that a small percentage of test administrators disagree that their student was able to respond regardless of disability, behavior, or health concerns; had access to all necessary supports; and was able to effectively use supports. In spring 2020, DLM staff conducted educator focus groups with educators who disagreed with one or more of these survey items to learn about potential accessibility gaps in the DLM System (Kobrin et al., 2022). A total of 18 educators from 11 states participated in six focus groups. The findings revealed that many of the challenges educators described were documented in existing materials (e.g., wanting clarification about allowable practices that are described in the Test Administration Manual, such as substituting materials; desired use of not-allowed practices like hand-over-hand that are used during instruction). DLM staff are using the focus group findings to review existing materials and develop new resources that better communicate information about allowable practices to educators.
4.4.2 Opportunity to Learn
Table 4.15 reports the opportunity to learn results. Approximately 54% of responses (n = 13,365) reported that most or all science testlets matched instruction. More specific measures of instructional alignment are planned to better understand the extent that content measured by DLM assessments matches students’ academic instruction.
|
None
|
Some (< half)
|
Most (> half)
|
All
|
Not applicable
|
||||||
|---|---|---|---|---|---|---|---|---|---|---|
| Subject | n | % | n | % | n | % | n | % | n | % |
| Science | 2,341 | 9.5 | 7,179 | 29.2 | 8,146 | 33.1 | 5,219 | 21.2 | 1,737 | 7.1 |
A subset of test administrators were asked to indicate the approximate number of hours they spent instructing students on each of the DLM science core ideas and in the science and engineering practices. Educators responded using a 6-point scale: 0 hours, 1–5 hours, 6–10 hours, 11–15 hours, 16–20 hours, or more than 20 hours. Table 4.16 and Table 4.17 indicate the amount of instructional time spent on DLM science core ideas and science and engineering practices, respectively. For all science core ideas and science and engineering practices, the most commonly selected response was 1–5 hours.
|
Number of hours
|
|||||||||||||
|---|---|---|---|---|---|---|---|---|---|---|---|---|---|
|
0
|
1–5
|
6–10
|
11–15
|
16–20
|
>20
|
||||||||
| Core Idea | Median | n | % | n | % | n | % | n | % | n | % | n | % |
| Physical Science | |||||||||||||
| Matter and its interactions | 1–5 hours | 1,826 | 24.6 | 2,351 | 31.7 | 1,281 | 17.3 | 809 | 10.9 | 644 | 8.7 | 500 | 6.7 |
| Motion and stability: Forces and interactions | 1–5 hours | 2,071 | 28.2 | 2,339 | 31.8 | 1,236 | 16.8 | 750 | 10.2 | 546 | 7.4 | 412 | 5.6 |
| Energy | 1–5 hours | 1,862 | 25.5 | 2,314 | 31.7 | 1,266 | 17.3 | 784 | 10.7 | 633 | 8.7 | 446 | 6.1 |
| Life Science | |||||||||||||
| From molecules to organisms: Structures and processes | 1–5 hours | 2,515 | 34.3 | 2,103 | 28.7 | 1,096 | 15.0 | 685 | 9.4 | 524 | 7.2 | 402 | 5.5 |
| Ecosystems: Interactions, energy, and dynamics | 1–5 hours | 1,740 | 23.7 | 2,209 | 30.1 | 1,309 | 17.8 | 841 | 11.4 | 697 | 9.5 | 555 | 7.5 |
| Heredity: Inheritance and variation of traits | 1–5 hours | 2,967 | 40.5 | 2,047 | 27.9 | 969 | 13.2 | 549 | 7.5 | 461 | 6.3 | 332 | 4.5 |
| Biological evolution: Unity and diversity | 1–5 hours | 2,685 | 36.8 | 2,119 | 29.0 | 1,047 | 14.3 | 610 | 8.3 | 494 | 6.8 | 351 | 4.8 |
| Earth and Space Science | |||||||||||||
| Earth’s place in the universe | 1–5 hours | 1,922 | 26.2 | 2,268 | 30.9 | 1,233 | 16.8 | 810 | 11.1 | 614 | 8.4 | 482 | 6.6 |
| Earth’s systems | 1–5 hours | 1,936 | 26.4 | 2,283 | 31.1 | 1,195 | 16.3 | 798 | 10.9 | 619 | 8.4 | 505 | 6.9 |
| Earth and human activity | 1–5 hours | 1,718 | 23.4 | 2,328 | 31.7 | 1,261 | 17.2 | 839 | 11.4 | 673 | 9.2 | 526 | 7.2 |
|
Number of hours
|
|||||||||||||
|---|---|---|---|---|---|---|---|---|---|---|---|---|---|
|
0
|
1–5
|
6–10
|
11–15
|
16–20
|
>20
|
||||||||
| Science and engineering practice | Median | n | % | n | % | n | % | n | % | n | % | n | % |
| Developing and using models | 1–5 hours | 1,964 | 26.7 | 2,566 | 34.9 | 1,200 | 16.3 | 664 | 9.0 | 536 | 7.3 | 430 | 5.8 |
| Planning and carrying out investigations | 1–5 hours | 1,755 | 23.9 | 2,450 | 33.4 | 1,315 | 17.9 | 758 | 10.3 | 584 | 8.0 | 472 | 6.4 |
| Analyzing and interpreting data | 1–5 hours | 1,482 | 20.3 | 2,373 | 32.5 | 1,361 | 18.6 | 811 | 11.1 | 689 | 9.4 | 595 | 8.1 |
| Using mathematics and computational thinking | 6–10 hours | 1,396 | 19.1 | 2,229 | 30.5 | 1,278 | 17.5 | 815 | 11.2 | 721 | 9.9 | 866 | 11.9 |
| Constructing explanations and designing solutions | 1–5 hours | 2,158 | 29.5 | 2,309 | 31.5 | 1,174 | 16.0 | 711 | 9.7 | 547 | 7.5 | 423 | 5.8 |
| Engaging in argument from evidence | 1–5 hours | 2,619 | 35.7 | 2,210 | 30.2 | 1,045 | 14.3 | 593 | 8.1 | 481 | 6.6 | 380 | 5.2 |
| Obtaining, evaluating, and communicating information | 1–5 hours | 1,706 | 23.2 | 2,269 | 30.9 | 1,228 | 16.7 | 789 | 10.7 | 694 | 9.5 | 657 | 8.9 |
Results from the test administrator survey were also correlated with total linkage levels mastered by grade band. The median of instructional time was calculated for each student across from educator responses at the core idea level. While a direct relationship between amount of instructional time and the total number of linkage levels mastered is not expected, as some students may spend a large amount of time on an area and demonstrate mastery at the lowest linkage level for each EE, we generally expect that students who mastered more linkage levels would also have spent more time in instruction. More evidence is needed to evaluate this assumption.
Table 4.18 summarizes the Spearman rank-order correlations between instructional time and the total number linkage levels mastered, by grade band and course. Correlations ranged from 0.14 to 0.26. Based on guidelines from Cohen (1988), the observed correlations were small. However, the correlation for Biology is based on data from only 219 students who both participated in the Biology assessment and had this block of the test administrator survey completed. Thus, these results should be interpreted with caution.
| Grade band | Correlation with instructional time |
|---|---|
| Elementary | .175 |
| Middle school | .157 |
| High school | .140 |
| Biology | .256 |
Another dimension of opportunity to learn is student engagement with instruction. The First Contact survey contains two questions about student engagement during computer- and educator-directed instruction. Table 4.19 shows the percentage of students who demonstrated different levels of attention by instruction type. Overall, 87% of students demonstrated fleeting or sustained attention to computer-directed instruction and 86% of students demonstrated fleeting or sustained attention to educator-directed instruction.
|
Demonstrates
little or no attention |
Demonstrates
fleeting attention |
Generally
sustains attention |
||||
|---|---|---|---|---|---|---|
| Type of instruction | n | % | n | % | n | % |
| Computer-directed (n = 42,089) | 5,347 | 12.7 | 23,037 | 54.7 | 13,705 | 32.6 |
| Educator-directed (n = 45,686) | 6,374 | 14.0 | 27,997 | 61.3 | 11,315 | 24.8 |
4.5 Conclusion
Delivery of the DLM System was designed to align with instructional practice and be responsive to individual student needs. Assessment delivery options allow for necessary flexibility to reflect student needs while also including constraints to maximize comparability and support valid interpretation of results. The dynamic nature of DLM assessment administration is reflected in the initial input through the First Contact survey, as well as adaptive routing between testlets. Evidence collected from the DLM System, test administration monitoring, and test administrators indicates that students are able to successfully interact with the system to demonstrate their knowledge, skills, and understandings.