3 Assessment Design and Development
Chapter 3 of the Dynamic Learning Maps® (DLM®) Alternate Assessment System 2015–2016 Technical Manual—Science (Dynamic Learning Maps Consortium, 2017) describes assessment design and development procedures. This chapter provides an overview of updates to item and test development for the 2021–2022 academic year. The first portion of the chapter provides an overview of 2021–2022 item writers’ characteristics, followed by the 2021–2022 external review of items, testlets, and texts based on criteria for content, bias, and accessibility. The next portion of the chapter describes field test testlets available for administration during 2021–2022, changes to the pool of operational items, and an evaluation of differential item functioning.
For a complete description of item and test development for DLM assessments, including information on the use of evidence-centered design and Universal Design for Learning in the creation of concept maps used to guide test development, see the 2015–2016 Technical Manual—Science (Dynamic Learning Maps Consortium, 2017).
3.1 Test Development Procedures
This section describes information pertaining to item writing and item writer demographics for the 2021–2022 year. For a complete summary of item and testlet development procedures that were developed and implemented in 2015–2016 and continue to be used in 2021–2022, see Chapter 3 of the 2015–2016 Technical Manual—Science (Dynamic Learning Maps Consortium, 2017).
3.1.1 Testlet and Item Writing
Item development for 2021–2022 was reduced in scope to support an initiative to review and refresh resources that guide the development of items and testlets.
3.1.1.1 Participants
Item writers were selected from the ATLAS MemberClicks database based on predetermined qualifications such as special education teaching experience and previous DLM item-writing experience. The database is a profile-based recruitment tool hosted in MemberClicks, a membership management software. Individuals create their participant profile, which can be accessed and updated at any time. We encourage individuals to update their profile information annually or at the time of event recruitment for reporting accuracy. Participant profiles include attribute fields to capture demographic, education, and work experience data. Item writers were assigned to a subject area based on their qualifications and previous DLM item writing experience. In total, 37 science item writers contributed to writing testlets during the 2021–2022 year.
The median and range of years of item writers’ teaching experience is shown in Table 3.1. Of the item writers who responded to the question, the median years of experience was 13 years for item writers of science testlets in pre-K–12 and 10 years of special education experience.
| Teaching Experience | n | Median | Range |
|---|---|---|---|
| Science | 29 | 12.0 | 4–35 |
| Pre-K–12 | 33 | 13.0 | 4–38 |
| Special education | 30 | 10.0 | 1–34 |
| * The n column indicates the number of nonmissing responses to the survey question |
High school was most commonly taught by item writers (n = 38; 28%). See Table 3.2 for a summary.
| Grade level | n | % |
|---|---|---|
| Grade 3 | 12 | 8.9 |
| Grade 4 | 15 | 11.1 |
| Grade 5 | 15 | 11.1 |
| Grade 6 | 16 | 11.9 |
| Grade 7 | 19 | 14.1 |
| Grade 8 | 20 | 14.8 |
| High school | 38 | 28.1 |
The level and most common types of degrees held by item writers are shown in Table 3.3 and Table 3.4, respectively. All science item writers held at least a bachelor’s degree. The majority of the science item writers (n = 31; 84%) also held a master’s degree, for which the most common field of study was special education (n = 10; 32%).
| Degree | n | % |
|---|---|---|
| Bachelor’s | 5 | 13.5 |
| Master’s | 31 | 83.8 |
| Other | 1 | 2.7 |
| Degree | n |
|---|---|
| Bachelor’s degree | |
| Education | 9 |
| Content specific | 4 |
| Special education | 8 |
| Other | 8 |
| Missing | 7 |
| Master’s degree | |
| Education | 8 |
| Content specific | 3 |
| Special education | 10 |
| Other | 8 |
| Missing | 2 |
Item writers reported a range of experience working with students with different disabilities, as summarized in Table 3.5. Item writers collectively had the most experience working with students with a significant cognitive disability, other health impairments, or multiple disabilities.
| Disability category | n | % |
|---|---|---|
| Blind/low vision | 14 | 5.6 |
| Deaf/hard of hearing | 16 | 6.4 |
| Emotional disability | 23 | 9.2 |
| Mild cognitive disability | 24 | 9.6 |
| Multiple disabilities | 29 | 11.6 |
| Orthopedic impairment | 19 | 7.6 |
| Other health impairment | 30 | 12.0 |
| Significant cognitive disability | 30 | 12.0 |
| Specific learning disability | 25 | 10.0 |
| Speech impairment | 25 | 10.0 |
| Traumatic brain injury | 16 | 6.4 |
The professional roles reported by the 2021–2022 item writers are shown in Table 3.6. Roles included educators, instructional coaches, district staff, and other (i.e., university staff, program coordinators, supervisors of instruction).
| Role | n | % |
|---|---|---|
| Classroom educator | 23 | 62.2 |
| District staff | 2 | 5.4 |
| Instructional coach | 3 | 8.1 |
| Other | 9 | 24.3 |
Science item writers were from 14 different states. Population density of schools in which item writers taught or held a position is reported in Table 3.7. Within the survey, rural was defined as a population living outside settlements of 1,000 or fewer inhabitants, suburban was defined as an outlying residential area of a city of 2,000-49,000 or more inhabitants, and urban was defined as a city of 50,000 inhabitants or more. The demographics for the item writers are presented in Table 3.8.
| Population density | n | % |
|---|---|---|
| Rural | 22 | 59.5 |
| Suburban | 7 | 18.9 |
| Urban | 8 | 21.6 |
| n | % | |
|---|---|---|
| Gender | ||
| Female | 33 | 89.2 |
| Male | 4 | 10.8 |
| Race | ||
| White | 31 | 83.8 |
| Other | 3 | 8.1 |
| African American | 2 | 5.4 |
| Chose not to disclose | 1 | 2.7 |
| Hispanic ethnicity | ||
| Non-Hispanic | 32 | 86.5 |
| Hispanic | 1 | 2.7 |
| Chose not to disclose | 4 | 10.8 |
3.1.1.2 Item Writing Process
The selected item writers completed independent asynchronous advanced training and later participated in a 2-day virtual item-writing event that was held on January 25–26, 2022. Item writer training included instruction on the item-writing process and peer review process. During the event, item-writing pairs collaborated and began to develop testlets. Following the virtual event, item writers continued producing and peer reviewing testlets virtually via a secure online platform through June 2022. A total of 270 testlets were written for science.
3.1.2 External Reviews
The purpose of external reviews of items and testlets is to evaluate whether the items and testlets measure the intended content, are accessible, and are free of biased or sensitive content. Panelists use external review criteria established for DLM alternate assessments to recommend items be accepted, revised, or rejected. Panelists also provide recommendations for revisions or an explanation for a “reject” rating. The test development team uses the collective feedback from the panelists to inform decisions about items and testlets before they are field-tested.
External review for 2021–2022 was held as a 2-day virtual event. Materials were updated to meet the needs of virtual panel meetings, including the advance training and facilitator and co-facilitator training. When held in person, one facilitator led the feedback discussion for each panel. This year, a facilitator and co-facilitator led the feedback discussions and recorded decisions for each panel meeting.
3.1.2.1 Review Recruitment, Assignments, and Training
Panelists were selected from the ATLAS MemberClicks database based on predetermined qualifications for each panel type. The ATLAS MemberClicks database is populated using a profile creation survey that captures demographic, education, and work experience of candidates from DLM partner states. Panelists were assigned to content, accessibility, or bias and sensitivity panels based on their qualifications.
There were 39 science reviewers: 16 on accessibility panels, 8 on content panels, and 15 on bias and sensitivity panels.
Prior to participating in the virtual panel meetings, panelists completed an advance training course that included an External Review Procedures module and a module for their assigned panel type. The content modules were subject specific, while the accessibility and bias and sensitivity modules were universal for all subjects. After each module, panelists completed a posttest and were required to score 80% or higher to pass advance training.
After completing the modules and corresponding posttests, panelists completed a practice activity that simulated the external review process for each panel type. Panelists used the criteria for their assigned panel type to complete this external review.
Following the completion of advance training, panelists completed asynchronous reviews on two or three collections of testlets dependent upon panel type. Collections had between 34 and 54 testlets, dependent on the panel type. Content panels had fewer testlets per collection, and bias and sensitivity and accessibility panels had more testlets per collection. Ratings from the asynchronous reviews were sorted and new collections were created containing items and testlets with discrepant panel ratings. Dependent on the subject, there were two to four virtual panel meetings led by facilitators and co-facilitators to obtain collective feedback about the items and testlets.
The median and range of years of teaching experience is shown in Table 3.9. The median years of experience for external reviewers was 15 years in pre-K–12 and 10 years in science.
| Teaching experience | Median | Range |
|---|---|---|
| Pre-K–12 | 15.0 | 5–35 |
| Science | 10.0 | 1–35 |
High school was most commonly taught by the external reviewers (n = 32; 28%). See Table 3.10 for a summary.
| Grade level | n | % |
|---|---|---|
| Grade 3 | 10 | 25.6 |
| Grade 4 | 11 | 28.2 |
| Grade 5 | 12 | 30.8 |
| Grade 6 | 15 | 38.5 |
| Grade 7 | 18 | 46.2 |
| Grade 8 | 17 | 43.6 |
| High school | 32 | 82.1 |
| Note. Reviewers could indicate multiple grade levels. |
The 39 external reviewers represented a highly qualified group of professionals. The level and most common types of degrees held by external reviewers are shown in Table 3.11 and Table 3.12, respectively. A majority (n = 35; 90%) also held a master’s degree, for which the most common field of study was special education (n = 13; 33%).
| Degree | n | % |
|---|---|---|
| Bachelor’s | 4 | 10.3 |
| Master’s | 35 | 89.7 |
| Degree | n | % |
|---|---|---|
| Bachelor’s degree | ||
| Education | 12 | 30.8 |
| Content specific | 1 | 2.6 |
| Special education | 10 | 25.6 |
| Other | 15 | 38.5 |
| Missing | 1 | 2.6 |
| Master’s degree | ||
| Education | 10 | 28.6 |
| Content specific | 2 | 5.7 |
| Special education | 14 | 40.0 |
| Other | 9 | 25.7 |
Most external reviewers had experience working with students with disabilities (77%), and 90% had experience with the administration of alternate assessments. The variation in percentages suggest some item writers may have had experience with administration of alternate assessments but perhaps did not regularly work with students with disabilities.
External reviewers reported a range of experience working with students with different disabilities, as summarized in Table 3.13. External reviewers collectively had the most experience working with students with a significant cognitive disability, multiple disabilities, or other health impairments.
| Disability category | n | % |
|---|---|---|
| Blind/low vision | 16 | 41.0 |
| Deaf/hard of hearing | 13 | 33.3 |
| Emotional disability | 21 | 53.8 |
| Mild cognitive disability | 23 | 59.0 |
| Multiple disabilities | 26 | 66.7 |
| Orthopedic impairment | 15 | 38.5 |
| Other health impairment | 24 | 61.5 |
| Significant cognitive disability | 26 | 66.7 |
| Specific learning disability | 23 | 59.0 |
| Speech impairment | 19 | 48.7 |
| Traumatic brain injury | 14 | 35.9 |
| Note. Reviewers could select multiple categories. |
Panelists had varying experience teaching students with the most significant cognitive disabilities. Science panelists had a median of 5.5 years of experience teaching students with the most significant cognitive disabilities, with a minimum of 3 years and a maximum of 10 years of experience.
The professional roles reported by the 2021–2022 reviewers are shown in Table 3.14. Roles included educators, instructional coaches, state education agency staff, and other (i.e., university staff, program coordinators, supervisors of instruction).
| Role | n | % |
|---|---|---|
| Instructional coach | 1 | 2.6 |
| Other | 4 | 10.3 |
| State education agency staff | 1 | 2.6 |
| Not specified | 1 | 2.6 |
| 32 | 82.1 |
Science panelists’ were from five different states. Population density of schools in which reviewers taught or held a position is reported in Table 3.15. Within the survey, rural was defined as a population living outside settlements of 1,000 or fewer inhabitants, suburban was defined as an outlying residential area of a city of 2,000-49,000 or more inhabitants, and urban was defined as a city of 50,000 inhabitants or more. The demographics for the external reviewers are presented in Table 3.16.
| Population density | n | % |
|---|---|---|
| Rural | 19 | 48.7 |
| Suburban | 5 | 12.8 |
| Urban | 15 | 38.5 |
| n | % | |
|---|---|---|
| Gender | ||
| Female | 32 | 82.1 |
| Male | 7 | 17.9 |
| Race | ||
| White | 31 | 79.5 |
| African American | 4 | 10.3 |
| Chose not to disclose | 2 | 5.1 |
| American Indian | 1 | 2.6 |
| Native Hawaiian or Pacific Islander | 1 | 2.6 |
| Hispanic ethnicity | ||
| Non-Hispanic | 36 | 92.3 |
| Hispanic | 2 | 5.1 |
| Chose not to disclose | 1 | 2.6 |
Prior to attending the on-site external review event, panelists completed an advance training course. The course included five modules that all panelists had to complete, allowing the panelists to gain familiarity with all areas being covered. All panelists completed the following modules: DLM Overview and External Review Process, Accessibility, Bias and Sensitivity, and Content. Each content module was subject-specific, while the bias and sensitivity and accessibility modules were universal for all subjects. After each module, the panelists had to complete a posttest and receive a score of at least 80% to continue to the next module. Panelists were required to complete advance training prior to reviewing any testlets at the event.
Review of testlets was completed only during the two days of the on-site event. Due to technical issues, not all panelists had time to review as many testlets as in prior years. As a consequence, some subject rooms saw fewer testlets reviewed than others. Panelists reviewed each testlet on their own and then as a group. Each group came to a consensus for each item and testlet, and the facilitator recorded the recommendation.
Panelists recommended most content be accepted. For science, the percentage of items and testlets rated as “accept” ranged from 44% to 91% and 50% to 96%, respectively. The percentage of items and testlets rated as “revise” ranged from 9% to 54% and 4% to 47% respectively. The rate at which both items and testlets were recommended for rejection ranged from 0% to 3% across grades, pools, and rounds of review.
3.1.2.2 Item and Testlet Decisions
Because each item and testlet was examined by three separate panels, external review ratings were compiled across panel types, following the same process as previous years. DLM test development teams reviewed and summarized the recommendations provided by the external reviewers for each item and testlet. Based on that combined information, staff had five decision options: (a) no pattern of similar concerns, accept as is; (b) pattern of minor concerns, will be addressed; (c) major revision needed; (d) reject; and (e) more information needed. Once the test development team views each item and testlet and considers the feedback provided by the panelists, it assigns a decision to each one.
The science test development team accepted as is, 56% of testlets and 30% of items. Of the items and testlets that were revised, most required major changes (e.g., stem or response option replaced) as opposed to minor changes (e.g., minor rewording but concept remained unchanged). The science test development team made 31 minor revisions to items, 250 major revisions to items, and rejected 26 testlets. Most of the content reviewed during this external review is scheduled for the spring 2023 window.
3.2 Evidence of Item Quality
Testlets are the fundamental unit of the DLM alternate assessments. Each year, testlets are added to and removed from the operational pool to maintain a pool of high-quality testlets. The following sections describe evidence of item quality, including evidence supporting field-test testlets available for administration, a summary of the operational pool, and evidence of differential item functioning (DIF).
3.2.1 Field Testing
During the 2021–2022 academic year, DLM field-test testlets were administered to evaluate item quality for EEs assessed at each grade level for science. Field testing is conducted to deepen operational pools so that multiple testlets are available in the spring assessment window, including making more content available at EEs and linkage levels that educators administer to students the most. By deepening the operational pool, testlets can also be evaluated for retirement in instances where other testlets perform better.
In this section we describe the field-test testlets administered in 2021–2022 and the associated review activities. A summary of prior field test events can be found in Chapter 3 of the 2015–2016 Technical Manual—Science (Dynamic Learning Maps Consortium, 2017) and subsequent annual DLM technical manual updates.
3.2.1.1 Description of Field Tests Administered in 2021–2022
Testlets were made available for field testing based on the availability of field-test content for each EE and linkage level.
During spring assessment window, field-test testlets were administered after completion of the operational assessment. A field-test testlet was assigned for an EE that was assessed during the operational assessment at a linkage level equal or adjacent to the linkage level of the operational testlet.
Table 3.17 summarizes the number of field-test testlets available during 2022. A total of 124 were available across grades.
| Grade | n |
|---|---|
| Elementary | 43 |
| Middle school | 33 |
| High school | 33 |
| Biology | 15 |
Participation in field testing was not required, but educators were encouraged to administer all available testlets to their students. In total, 26,926 (61%) students completed at least one field-test testlet. In the spring assessment window, 88% of field-test testlets had a sample size of at least 20 students (i.e., the threshold for item review).
3.2.1.2 Field-Test Data Review
Data collected during each field test are compiled, and statistical flags are implemented ahead of test development team review. Flagging criteria serve as a source of evidence for test development teams in evaluating item quality; however, final judgments are content based, taking into account the testlet as a whole, the linkage level the items were written to assess, and pool depth.
Review of field-test data occurs annually during February and March. This includes data from the previous spring assessment window. That is, the review in February and March of 2022 includes field-test data collected during the 2021 spring assessment window. Data that were collected during the 2022 spring assessment window will be reviewed in February and March of 2023, with results included in the 2022–2023 technical manual update.
Test development teams for each subject make four types of item-level decisions as they review field-test items flagged for either a p-value or a standardized difference value beyond the threshold:
- No changes made to item. Test development team decided item can go forward to operational assessment.
- Test development team identified concerns that required modifications. Modifications were clearly identifiable and were likely to improve item performance.
- Test development team identified concerns that required modifications. The content was worth preserving rather than rejecting. Item review may not have clearly pointed to specific edits that were likely to improve the item.
- Rejected item. Test development team determined the item was not worth revising.
For an item to be accepted as is, the test development team had to determine that the item was consistent with DLM item-writing guidelines and that the item was aligned to the linkage level. An item or testlet was rejected completely if it was inconsistent with DLM item-writing guidelines, if the EE and linkage level were covered by other testlets that had better-performing items, or if there was no clear content-based revision to improve the item. In some instances, a decision to reject an item resulted in the rejection of the testlet, as well.
Common reasons for flagging an item for modification included items that were misaligned to the linkage level, distractors that could be argued as partially correct, or unnecessary complexity in the language of the stem. After reviewing flagged items, the reviewers looked at all items rated as three or four within the testlet to help determine whether to retain or reject the testlet. Here, the test development team could elect to keep the testlet (with or without revision) or reject it. If a revision was needed, it was assumed the testlet needed field testing again. The entire testlet was rejected if the test development team determined the flagged items could not be adequately revised.
3.2.1.3 Results of Item Analysis
Criteria used for item flagging during previous field test events were retained for 2021–2022. Items were flagged for review by test development teams if they met either of the following statistical criteria:
The item was too challenging, as indicated by a p-value of less than .35. This value was selected as the threshold for flagging because most DLM items offer three response options, so a value of less than .35 may indicate less than chance selection of the correct response option.
The item was significantly easier or harder than other items assessing the same EE and linkage level, as indicated by a weighted standardized difference greater than two standard deviations from the mean p-value for that EE and linkage level combination.
Figure 3.1 summarizes the p-values for items that met the minimum sample size threshold of 20. Most items fell above the .35 threshold for flagging. Test development teams for each subject reviewed items below the threshold.
Figure 3.1: p-values for Science Field-Test Items
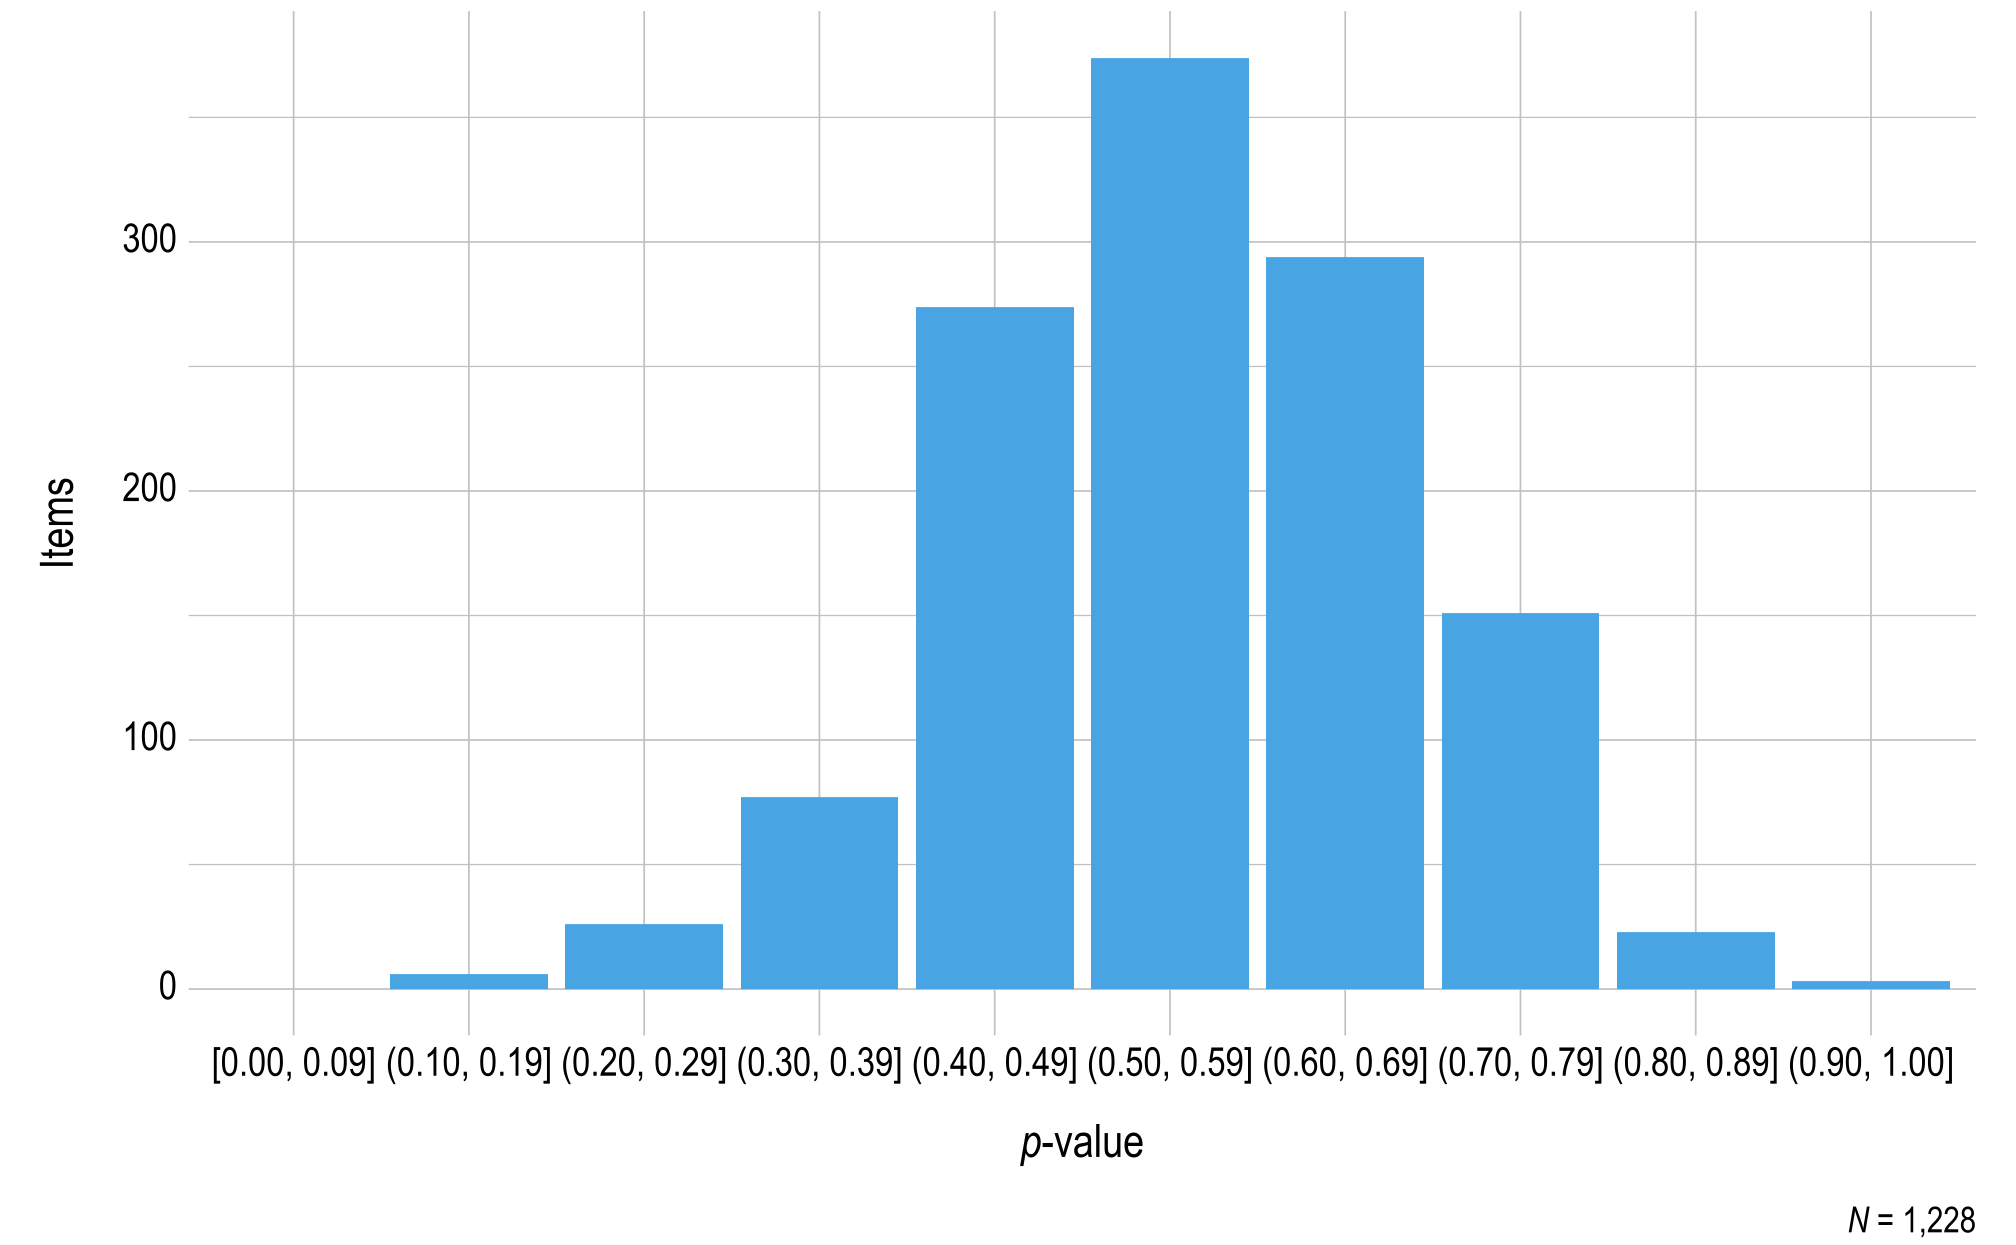
Items with a sample size of less than 20 were omitted.
Figure 3.2 summarizes the standardized difference values for items field tested during the spring assessment window for science. Most items fell within two standard deviations of the mean for the EE and linkage level. Items beyond the threshold were reviewed by test development teams for each subject.
Figure 3.2: Standardized Difference Z-Scores for Science Field-Test Items
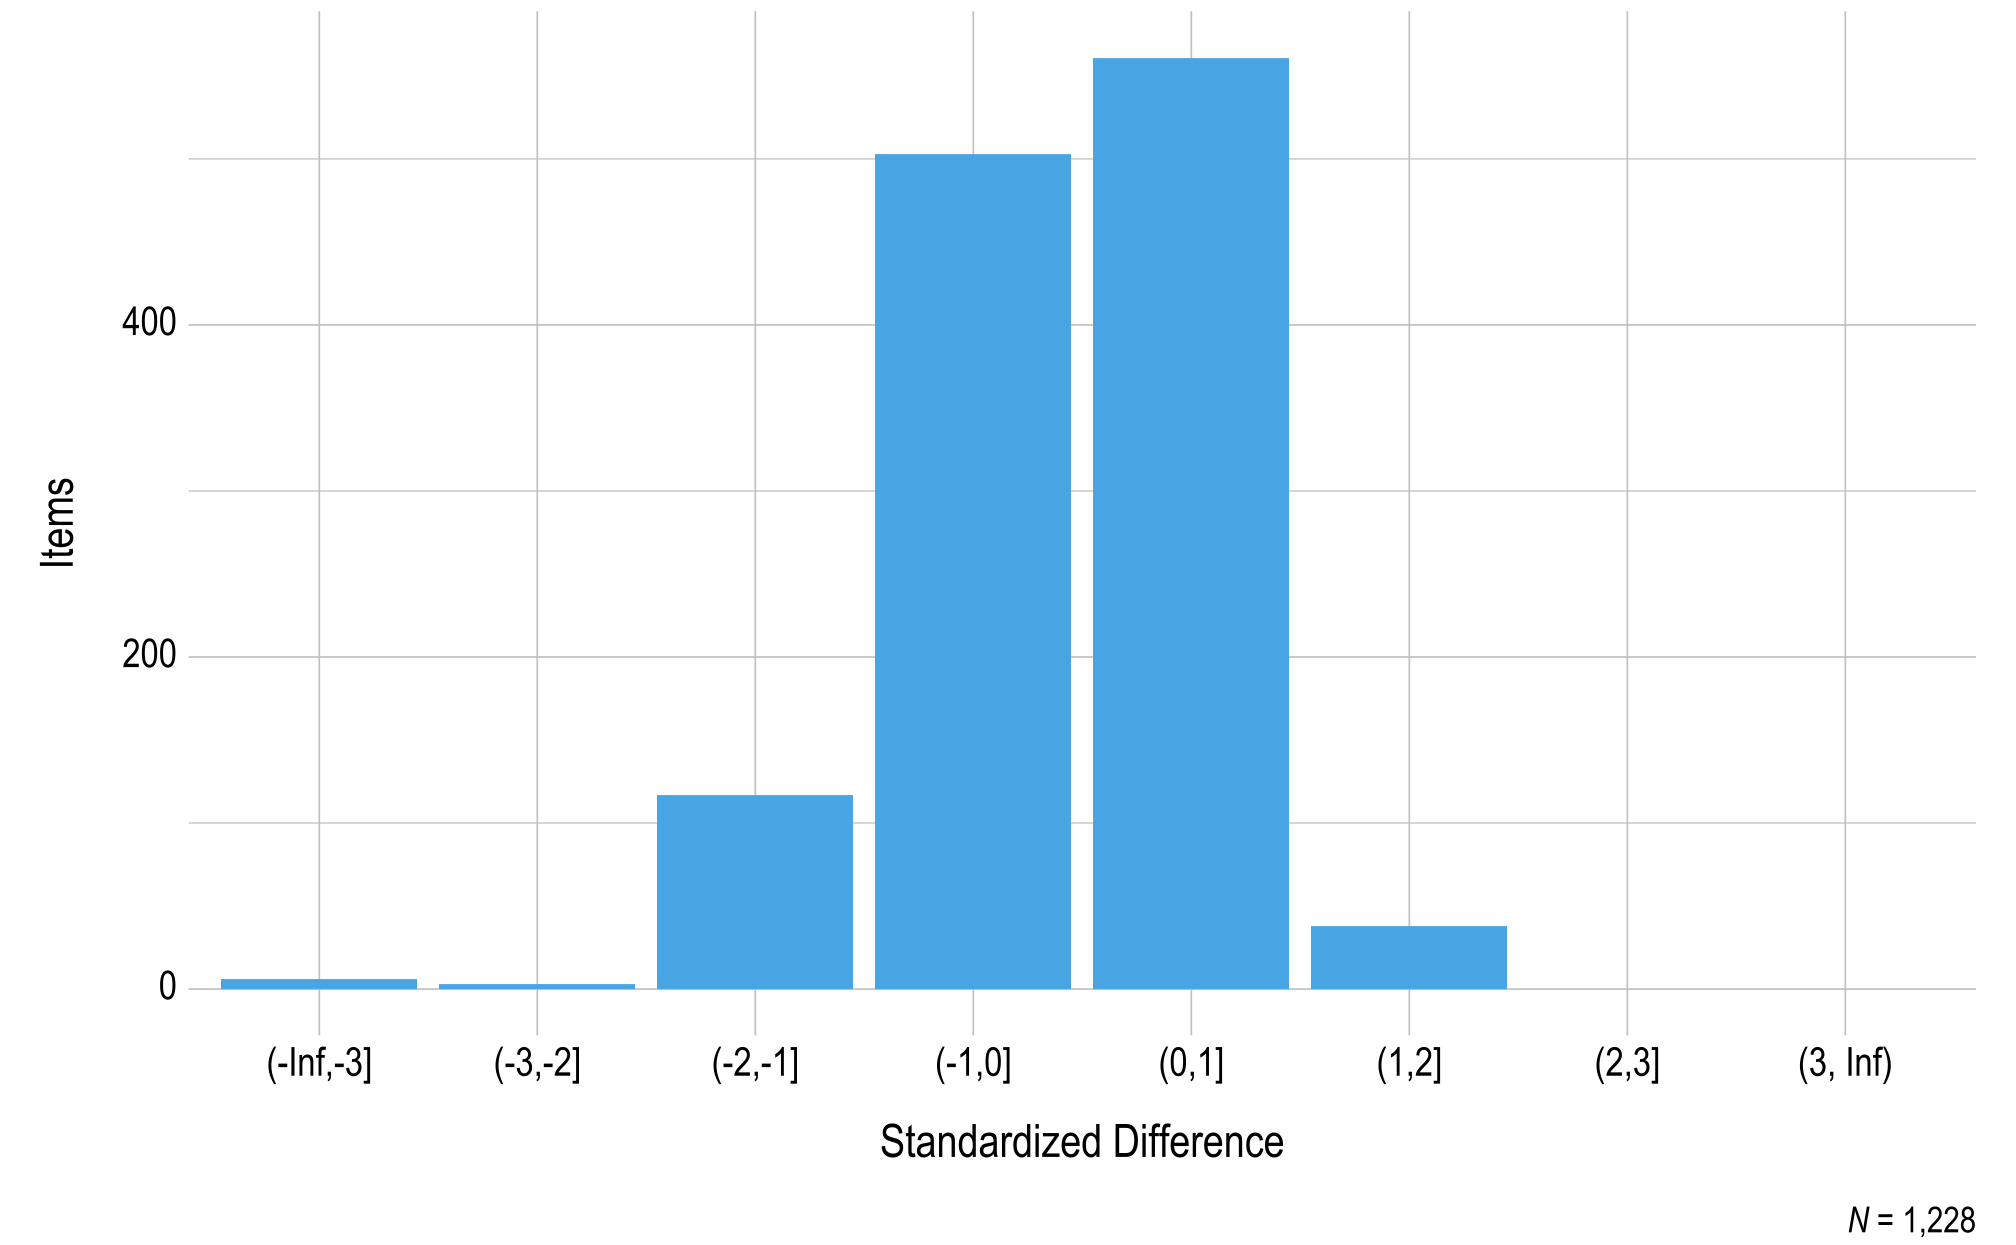
Items with a sample size of less than 20 were omitted.
A total of 10 science testlets (14%) had at least one item flagged due to their p-value and/or standardized difference value. Test development teams reviewed all flagged items and their context within the testlet to identify possible reasons for the flag and to determine whether an edit was likely to resolve the issue.
Of the 64 science testlets that were not flagged, four (6%) were edited and reassigned to the field-test pool, 45 (70%) were promoted to the operational pool to maintain pool depth given content-based testlet retirement, seven (11%) were sent back to the field-test pool with no edits for additional data collection to get estimates of item difficulty that are based on larger samples, and eight (12%) were rejected and retired. Of the 10 science testlets that were flagged, three (30%) were edited and reassigned to the field-test pool, one (10%) was promoted to the operational pool to maintain pool depth given content-based testlet retirement, two (20%) were sent back to the field-test pool with no edits for additional data collection to get estimates of item difficulty that are based on larger samples, and four (40%) were rejected and retired.
3.2.2 Operational Assessment Items for 2021–2022
The DLM assessments include a total of 152 operational testlets. Because the operational pool needs to be deepened, particularly for content at the Essential Elements (EEs) and linkage levels that are administered to students the most, updates are made to the operational pool each year. The primary updates are promoting testlets to the operational pool and removing testlets from the operational pool.
Testlets are promoted to the operational pool via field testing, with students who completed the operational assessment in the spring. Field-test testlets are eligible for review after they have been completed by at least 20 students. As mentioned in the field testing section above (section 3.2.1), there are multiple item quality indicators that are considered when deciding whether to promote an item to the operational pool. Statistically, items are expected to be appropriately difficult and to function similarly to items measuring the same EE and linkage level. To review these statistical item quality indicators, the difficulty and internal consistency of items on field-test testlets are evaluated. Items are also expected to be consistent with DLM item-writing guidelines and aligned with the assessed linkage level. To review these content-based item quality indicators, the quality of the eligible items on the field-test testlets is evaluated, and the test development team makes decisions of whether to accept or reject the items on the field-test testlets. For a full description of field testing, see above in section 3.2.1.
Testlets are removed from the operational pool via retirement based on item quality standards. There are several processes that can lead an item or testlet to be prioritized for retirement. Items are evaluated for evidence of model fit, and the results of these evaluations may be used to prioritize items and testlets for retirement. Items are also evaluated for evidence of DIF, and these results may be used to prioritize items and testlets for retirement. This process is described in section 3.2.3. Finally, the test development team periodically reviews the content pool and prioritizes testlets for retirement. These reviews refresh the operational pool by removing older content when newer content is available.
For 2021–2022, 46 science testlets were promoted to the operational pool from field testing in 2020–2021.
Testlets were made available for operational testing in 2021–2022 based on the 2020–2021 operational pool and the promotion of testlets field-tested during 2020–2021 to the operational pool following their review. Table 3.18 summarizes the total number of operational testlets for 2021–2022. In total, there were 152 operational testlets available. This total included 36 EE/linkage level combinations for which both a general version and a version for students who are blind or visually impaired or read braille were available.
| Grade | n |
|---|---|
| Elementary | 39 |
| Middle school | 41 |
| High school | 41 |
| Biology | 31 |
| Note: Three Essential Elements are shared across the high school and Biology assessments. |
3.2.2.1 Educator Perception of Assessment Content
Each year, test administrators are asked two questions about their perceptions of the assessment content; Participation in the test administrator survey is described in Chapter 4 of this manual. Table 3.19 describes their responses in 2021–2022. Questions pertained to whether the DLM assessments measured important academic skills and reflected high expectations for their students.
Test administrators generally responded that content reflected high expectations for their students (86% agreed or strongly agreed) and measured important academic skills (77% agreed or strongly agreed). While the majority of test administrators agreed with these statements, 14%–23% disagreed. DLM assessments represent a departure from the breadth of academic skills assessed by many states’ previous alternate assessments. Given the short history of general curriculum access for this population and the tendency to prioritize the instruction of functional academic skills (Karvonen et al., 2011), test administrators’ responses may reflect awareness that DLM assessments contain challenging content. However, test administrators were divided on its importance in the educational programs of students with the most significant cognitive disabilities. Feedback from focus groups with educators focusing on score reports reflected similar variability in educator perceptions of assessment content (Clark et al., 2018, 2022).
|
Strongly
disagree |
Disagree
|
Agree
|
Strongly
agree |
|||||
|---|---|---|---|---|---|---|---|---|
| Statement | n | % | n | % | n | % | n | % |
| Content measured important academic skills and knowledge for this student. | 2,262 | 9.1 | 3,535 | 14.2 | 14,655 | 58.7 | 4,510 | 18.1 |
| Content reflected high expectations for this student. | 1,193 | 4.8 | 2,378 | 9.6 | 14,712 | 59.4 | 6,500 | 26.2 |
3.2.2.2 Psychometric Properties of Operational Assessment Items for 2021–2022
The proportion correct (p-value) was calculated for all operational items to summarize information about item difficulty.
Figure 3.3 shows the p-values for each operational item in science. To prevent items with small sample sizes from potentially skewing the results, the sample size cutoff for inclusion in the p-value plots was 20. In total, zero items (<1% of all items) were excluded due to small sample size. The p-values for most science items were between .4 and .7.
Figure 3.3: p-values for Science 2022 Operational Items
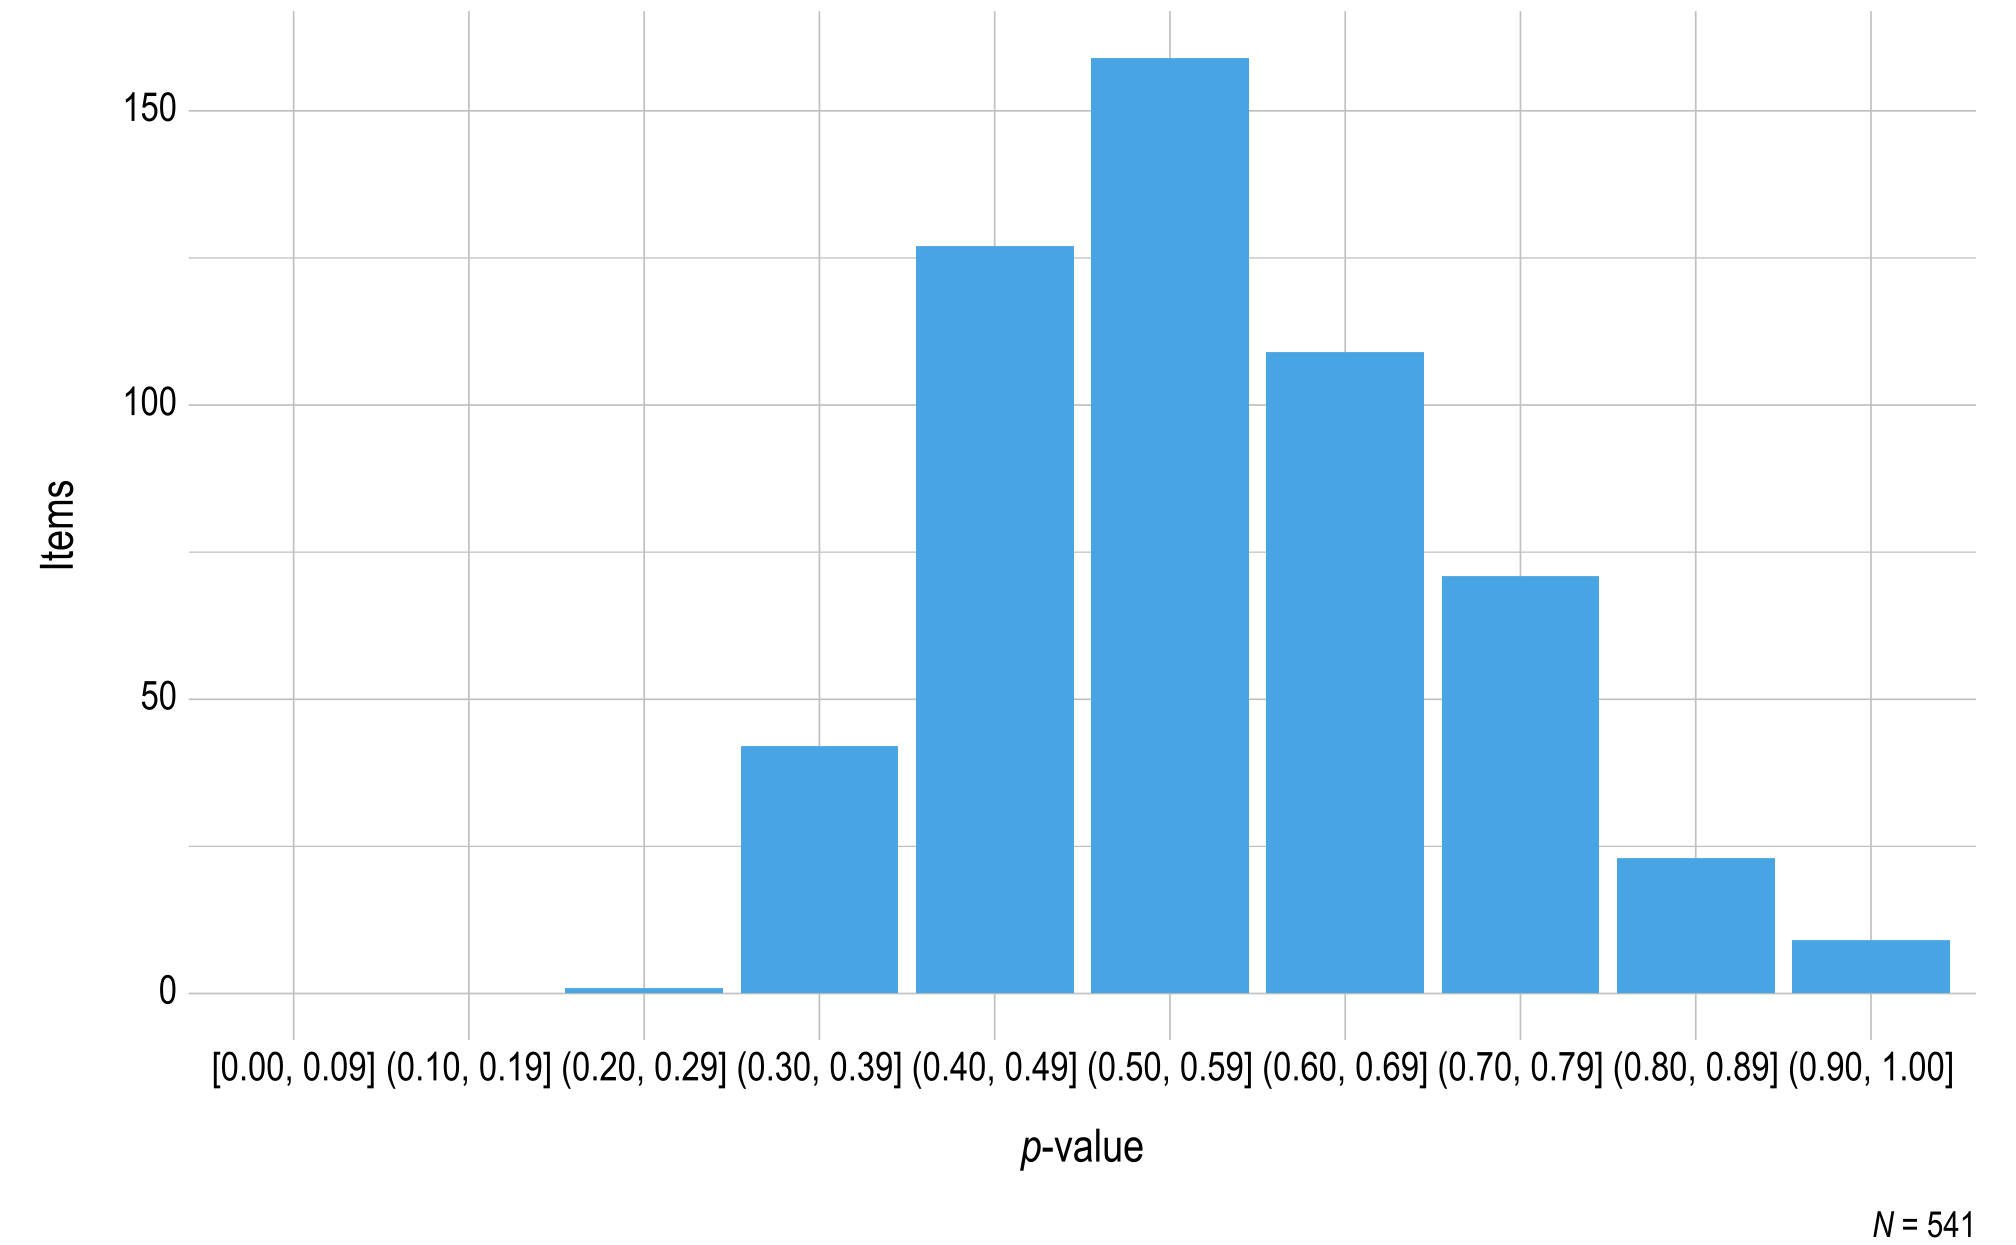
Note. Items with a sample size of less than 20 were omitted.
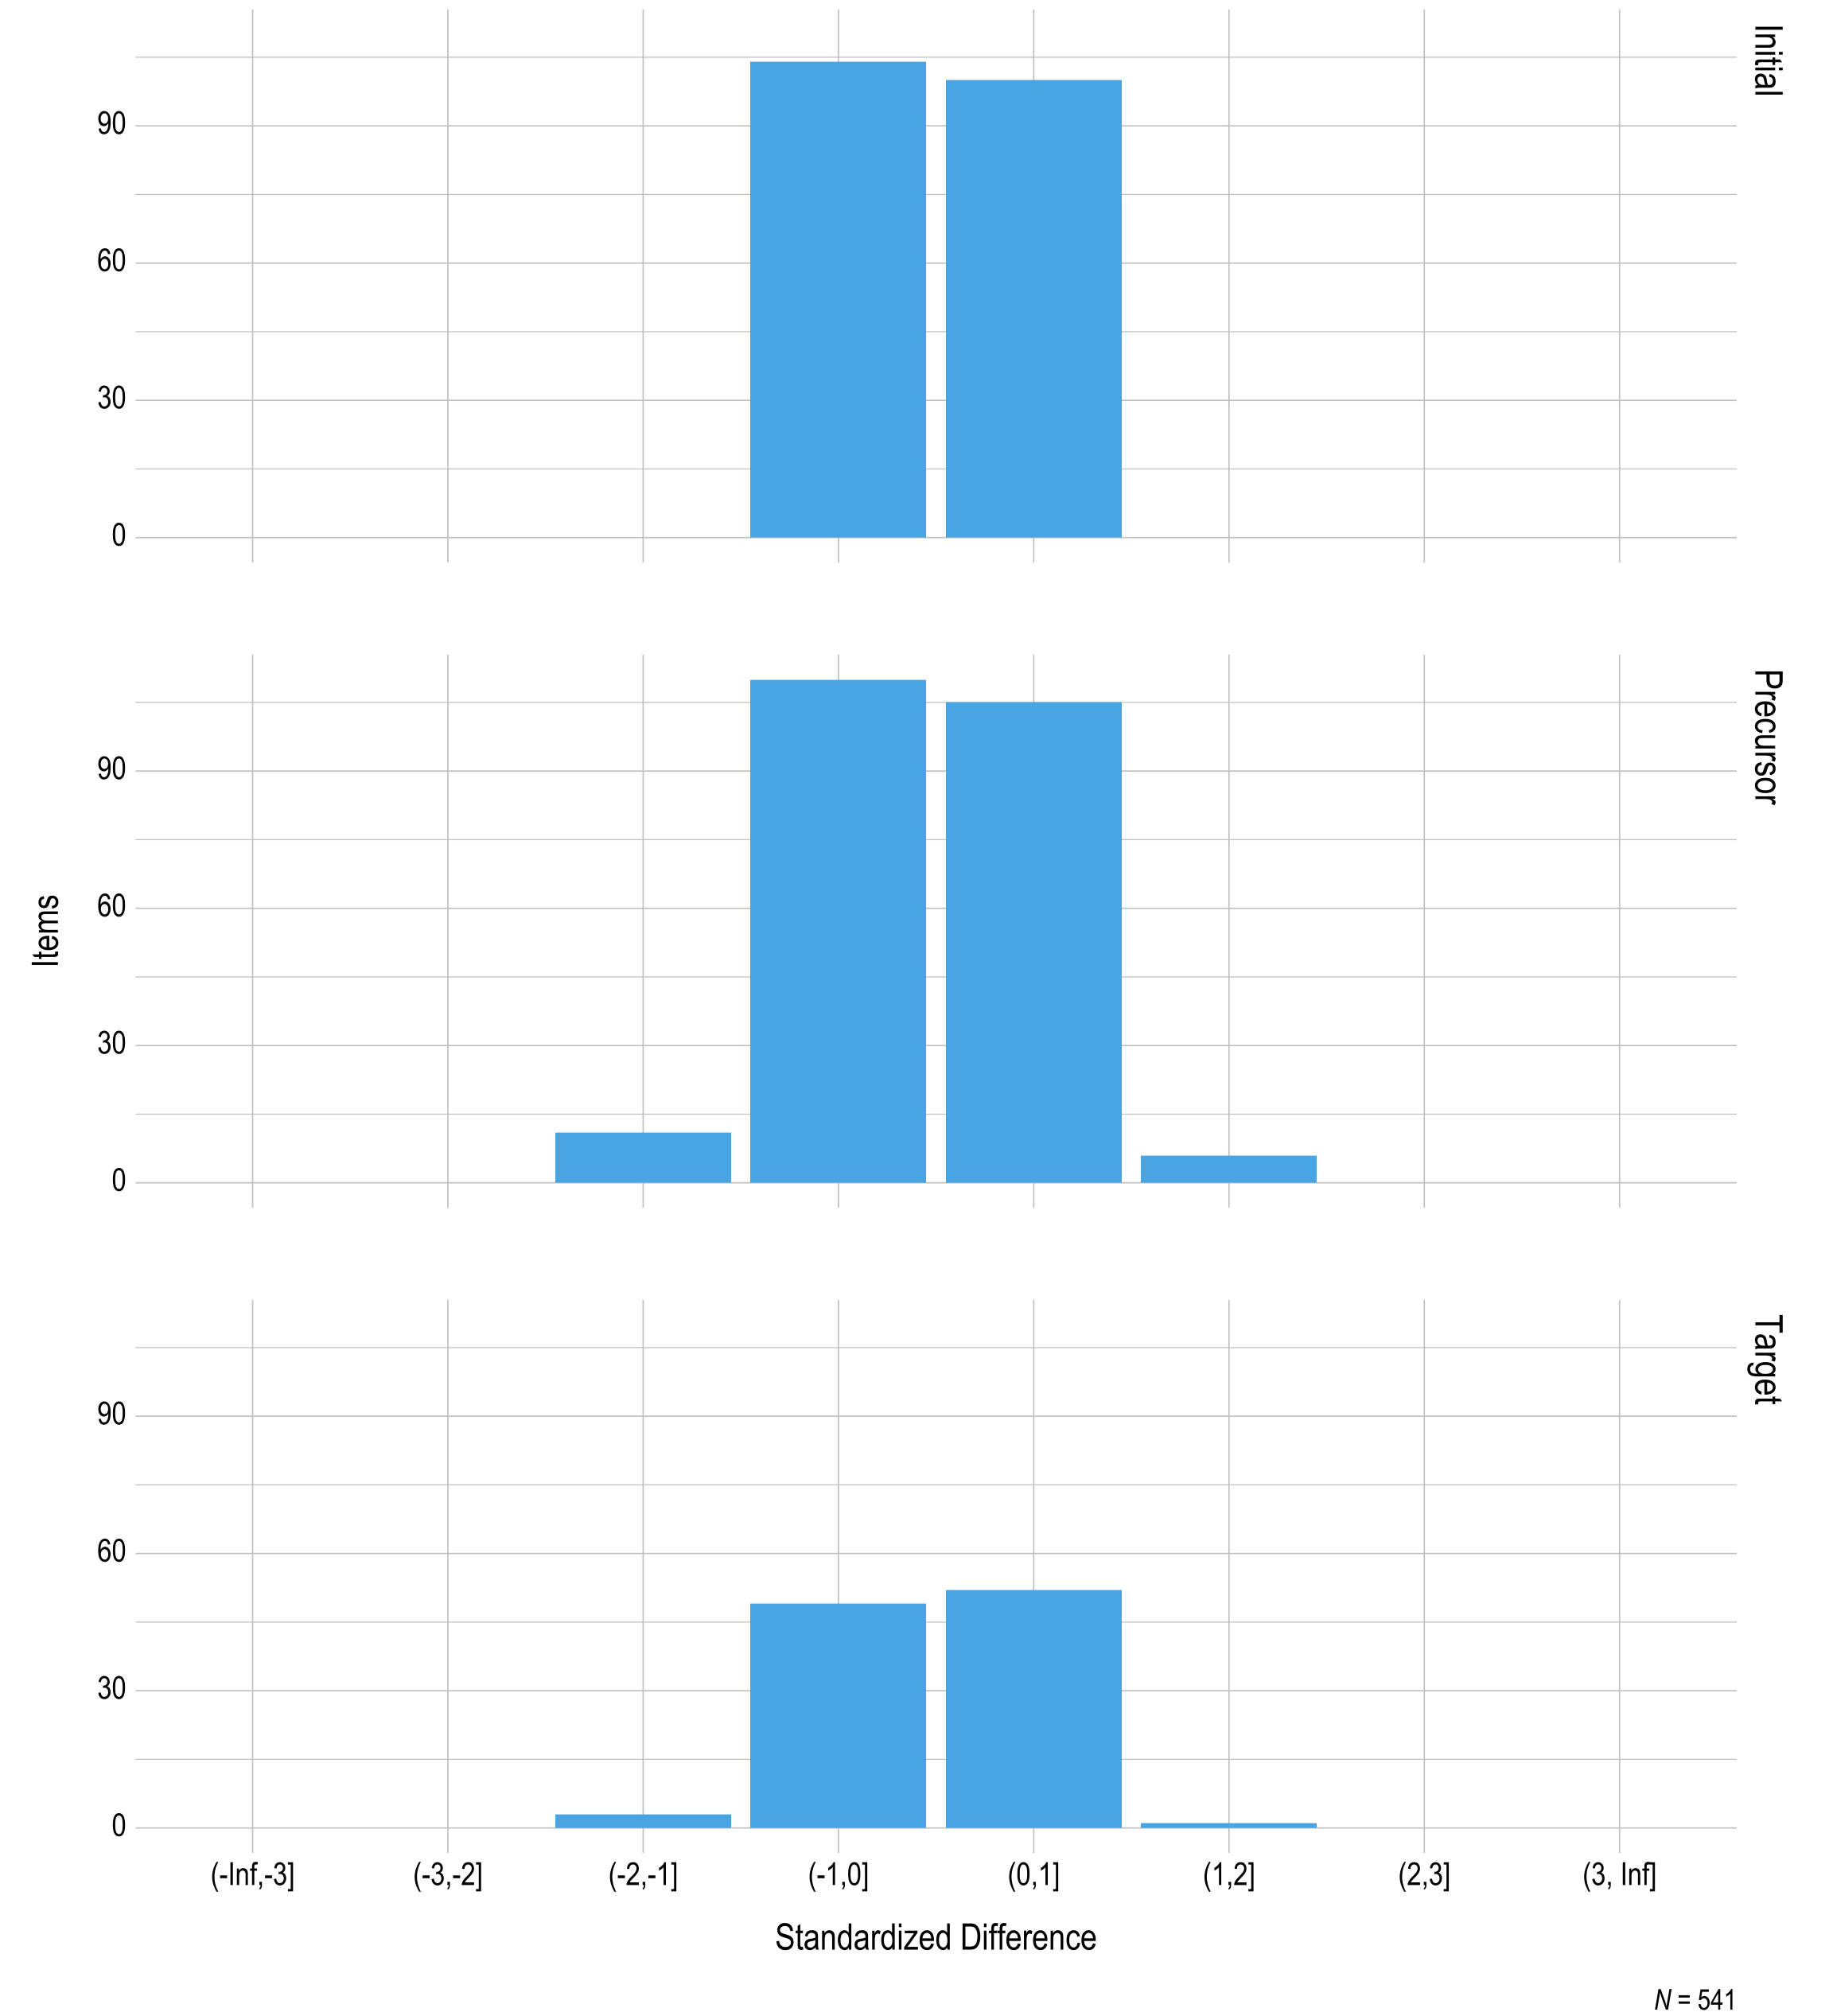
Items in the DLM assessments are fungible (i.e., interchangeable) within each EE and linkage level, meaning that the items are expected to function identically to the other items measuring the same EE and linkage level. To evaluate the fungibility assumption, standardized difference values were also calculated for all operational items, with a student sample size of at least 20 required to compare the p-value for the item to all other items measuring the same EE and linkage level. If an item is fungible with the other items measuring the same EE and linkage level, the item is expected to have a nonsignificant standardized difference value. The standardized difference values provide one source of evidence of internal consistency.
Figure 3.4 summarizes the standardized difference values for operational items for science. Of all items measuring the EE and linkage level, 100% of items fell within two standard deviations of the mean. As additional data are collected and decisions are made regarding item pool replenishment, test development teams will consider item standardized difference values, along with item misfit analyses, when determining which items and testlets are recommended for retirement.
Figure 3.4: Standardized Difference Z-Scores for Science 2021–2022 Operational Items
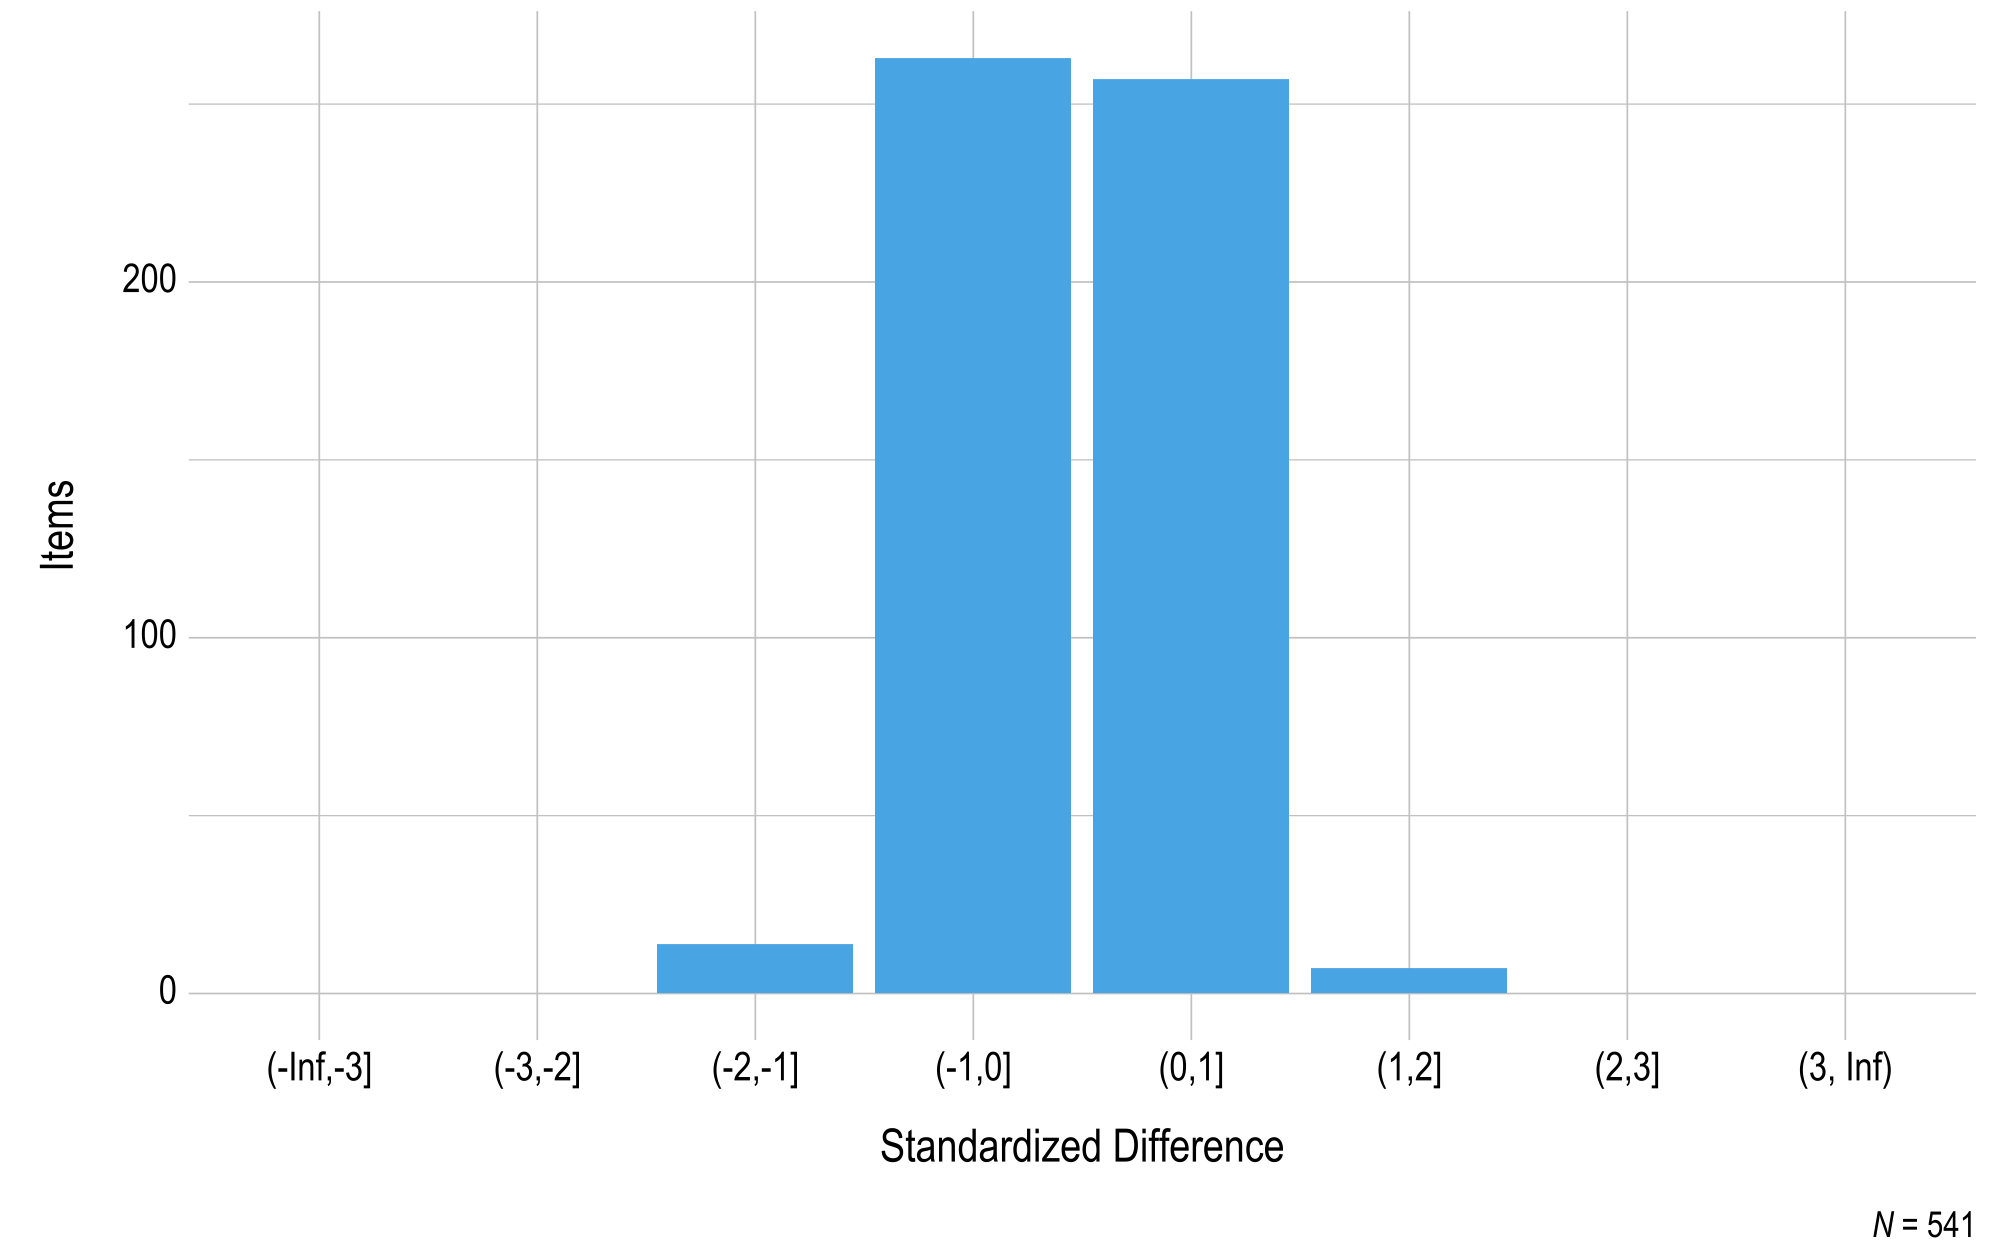
Note. Items with a sample size of less than 20 were omitted.
Figure 3.5 summarizes the standardized difference values for operational items by linkage level. Most items fell within two standard deviations of the mean of all items measuring the respective EE and linkage level, and the distributions are consistent across linkage levels.
Figure 3.5: Standardized Difference Z-Scores for 2021–2022 Operational Items by Linkage Level
Note. Items with a sample size of less than 20 were omitted.
3.2.3 Evaluation of Item-Level Bias
DIF addresses the challenges created when some test items are more difficult for some groups of examinees despite these examinees having knowledge and understanding of the assessed concepts (Camilli & Shepard, 1994). DIF analyses can uncover internal inconsistency if particular items are functioning differently in a systematic way for identifiable subgroups of students (American Educational Research Association et al., 2014). While identification of DIF does not always indicate a weakness in the test item, it can point to construct-irrelevant variance, posing considerations for validity and fairness.
3.2.3.1 Method
DIF analyses examined race in addition to gender. Analyses included data from 2015–2016 through 2020–2021 DIF analyses are conducted on the sample of data used to update the model calibration, which uses data through the previous operational assessment. See Chapter 5 of this manual for more information. to flag items for evidence of DIF. Items were selected for inclusion in the DIF analyses based on minimum sample-size requirements for the two gender subgroups (male and female) and for race subgroups: white, African American, Asian, American Indian, Native Hawaiian or Pacific Islander, Alaska Native, and multiple races.
The DLM student population is unbalanced in both gender and race. The number of female students responding to items is smaller than the number of male students by a ratio of approximately 1:2. Similarly, the number of nonwhite students responding to items is smaller than the number of white students by a ratio of approximately 1:2. Therefore, on advice from the DLM Technical Advisory Committee, the threshold for item inclusion requires that the focal group must have at least 100 students responding to the item. The threshold of 100 was selected to balance the need for a sufficient sample size in the focal group with the relatively low number of students responding to many DLM items.
Additional criteria were included to prevent estimation errors. Items with an overall proportion correct (p-value) greater than .95 or less than .05 were removed from the analyses. Items for which the p-value for one gender or racial group was greater than .97 or less than .03 were also removed from the analyses.
For each item, logistic regression was used to predict the probability of a correct response, given group membership and performance in the subject. Specifically, the logistic regression equation for each item included a matching variable comprised of the student’s total linkage levels mastered in the subject of the item and a group membership variable, with the reference group (i.e., males for gender, white for race) coded as 1 and the focal group (i.e., females for gender; African American, Asian, American Indian, Native Hawaiian or Pacific Islander, Alaska Native, or two or more races for race) coded as 0. An interaction term was included to evaluate whether nonuniform DIF was present for each item (Swaminathan & Rogers, 1990); the presence of nonuniform DIF indicates that the item functions differently because of the interaction between total linkage levels mastered and the student’s group (i.e., gender or racial group). When nonuniform DIF is present, the group with the highest probability of a correct response to the item differs along the range of total linkage levels mastered; thus, one group is favored at the low end of the spectrum and the other group is favored at the high end.
Three logistic regression models were fitted for each item:
\[\begin{align} \text{M}_0\text{: } \text{logit}(\pi_i) &= \beta_0 + \beta_1\text{X} \tag{3.1} \\ \text{M}_1\text{: } \text{logit}(\pi_i) &= \beta_0 + \beta_1\text{X} + \beta_2G \tag{3.2} \\ \text{M}_2\text{: } \text{logit}(\pi_i) &= \beta_0 + \beta_1\text{X} + \beta_2G + \beta_3\text{X}G\tag{3.3} \end{align}\]where \(\pi_i\) is the probability of a correct response to item i, \(\text{X}\) is the matching criterion, \(G\) is a dummy coded grouping variable (0 = reference group, 1 = focal group), \(\beta_0\) is the intercept, \(\beta_1\) is the slope, \(\beta_2\) is the group-specific parameter, and \(\beta_3\) is the interaction term.
Because of the number of items evaluated for DIF, Type I error rates were susceptible to inflation. The incorporation of an effect-size measure can be used to distinguish practical significance from statistical significance by providing a metric of the magnitude of the effect of adding group and interaction terms to the regression model.
For each item, the change in the Nagelkerke pseudo \(R^2\) measure of effect size was captured, from \(M_0\) to \(M_1\) or \(M_2\), to account for the effect of the addition of the group and interaction terms to the equation. All effect-size values were reported using both the Zumbo and Thomas (1997) and Jodoin and Gierl (2001) indices for reflecting a negligible, moderate, or large effect. The Zumbo and Thomas thresholds for classifying DIF effect size are based on Cohen’s (1992) guidelines for identifying a small, medium, or large effect. The thresholds for each level are .13 and .26; values less than .13 have a negligible effect, values between .13 and .26 have a moderate effect, and values of .26 or greater have a large effect. The Jodoin and Gierl thresholds are more stringent, with lower threshold values of .035 and .07 to distinguish between negligible, moderate, and large effects.
3.2.3.2 Results
Using the above criteria for inclusion, 471 (87%) items were selected for gender, and 471 (87%) items were selected for at least one racial group comparison. The number of items evaluated by grade in science for gender ranged from 148 in grade 3–5 to 164 in grade 6–8. The number of items evaluated by grade in science for race ranged from 148 in grade 3–5 to 164 in grade 6–8. Because students taking DLM assessments represent seven possible racial groups, See Chapter 7 of this manual for a summary of participation by race and other demographic variables. there are up to six comparisons that can be made for each item, with the white group as the reference group and each of the other six groups (i.e., African American, Asian, American Indian, Native Hawaiian or Pacific Islander, Alaska Native, two or more races) as the focal group. Across all items, this results in 3,246 possible comparisons. Using the inclusion criteria specified above, 1,869 (58%) item and focal group comparisons were selected for analysis. Overall, five items were evaluated for two racial focal groups, 18 items were evaluated for three racial focal groups, 435 items were evaluated for four racial focal groups, and 13 items were evaluated for five racial focal groups. One racial focal group and the white reference group were used in each comparison. Table 3.20 shows the number of items that were evaluated for each racial focal group. Across all gender and race comparisons, sample sizes for each comparison ranged from 2,929 to 21,257 for gender and from 2,076 to 17,745 for race.
| Focal group | Items (n) |
|---|---|
| African American | 471 |
| American Indian | 448 |
| Asian | 466 |
| Native Hawaiian or Pacific Islander | 13 |
| Two or more races | 471 |
Of the 70 items (13% of the operational item pool) that were not included in the DIF analysis for gender, 70 (100%) had a focal group sample size of less than 100. A total of 70 items were not included in the DIF analysis for race for any of the subgroups. Of the 1,377 item and focal group comparisons that were not included in the DIF analysis for race, 1,361 (99%) had a focal group sample size of less than 100 and 16 (1%) had a subgroup p-value greater than .97. Table 3.21 and Table 3.22 show the number and percentage of items that did not meet each inclusion criteria for gender and race, respectively, by the linkage level the items assess.
|
Sample
size |
Item
proportion correct |
Subgroup
proportion correct |
||||
|---|---|---|---|---|---|---|
| Subject | n | % | n | % | n | % |
| Initial | 22 | 31.4 | 0 | 0.0 | 0 | 0.0 |
| Precursor | 25 | 35.7 | 0 | 0.0 | 0 | 0.0 |
| Target | 23 | 32.9 | 0 | 0.0 | 0 | 0.0 |
|
Sample
size |
Item
proportion correct |
Subgroup
proportion correct |
||||
|---|---|---|---|---|---|---|
| Subject | n | % | n | % | n | % |
| Initial | 499 | 36.7 | 0 | 0.0 | 0 | 0.0 |
| Precursor | 569 | 41.8 | 0 | 0.0 | 7 | 43.8 |
| Target | 293 | 21.5 | 0 | 0.0 | 9 | 56.2 |
3.2.3.2.1 Uniform Differential Item Functioning Model
A total of 108 items for gender were flagged for evidence of uniform DIF when comparing \(\text{M}_0\) to \(\text{M}_1\). Additionally, 257 item and focal group combinations across 196 items for race were flagged for evidence of uniform DIF. Table 3.23 and Table 3.24 summarize the total number of combinations flagged for evidence of uniform DIF by grade for gender and race, respectively. The percentage of combinations flagged for uniform DIF ranged from 16% to 27% for gender and from 12% to 15% for race.
| Grade | Items flagged (n) | Total items (N) | Items flagged (%) | Items with moderate or large effect size (n) |
|---|---|---|---|---|
| 3–5 | 23 | 148 | 15.5 | 0 |
| 6–8 | 45 | 164 | 27.4 | 0 |
| 9–12 | 40 | 159 | 25.2 | 0 |
| Grade | Items flagged (n) | Total items (N) | Items flagged (%) | Items with moderate or large effect size (n) |
|---|---|---|---|---|
| 3–5 | 71 | 578 | 12.3 | 0 |
| 6–8 | 91 | 649 | 14.0 | 1 |
| 9–12 | 95 | 642 | 14.8 | 0 |
For gender, using the Zumbo and Thomas (1997) effect-size classification criteria, all combinations were found to have a negligible effect-size change after the gender term was added to the regression equation. When using the Jodoin and Gierl (2001) effect-size classification criteria, all combinations were found to have a negligible effect-size change after the gender term was added to the regression equation.
The results of the DIF analyses for race were similar to those for gender. When using the Zumbo and Thomas (1997) effect-size classification criteria, all but one combination were found to have a negligible effect-size change after the race term was added to the regression equation. Similarly, when using the Jodoin and Gierl (2001) effect-size classification criteria, all but one combination were found to have a negligible effect-size change after the race term was added to the regression equation.
Table 3.25 provides information about the flagged items with a non-negligible effect-size change after the addition of the group term, as represented by a value of B (moderate) or C (large). The \(\beta_2G\) values in Table 3.25 indicate which group was favored on the item after accounting for total linkage levels mastered, with positive values indicating that the focal group had a higher probability of success on the item and negative values indicating that the focal group had a lower probability of success on the item. The focal group was favored on one combination.
| Item ID | Focal | Grade | EE | \(\chi^2\) | \(p\)-value | \(\beta_2G\) | \(R^2\) | Z&T* | J&G* |
|---|---|---|---|---|---|---|---|---|---|
| 51571 | Asian | 6–8 | SCI.EE.MS.ESS3-3 | 15.02 | < .001 | 0.31 | .901 | C | C |
| Note. EE = Essential Element; Z&T = Zumbo & Thomas; J&G = Jodoin & Gierl. | |||||||||
| * Effect-size measure. |
3.2.3.2.2 Combined Model
A total of 139 items were flagged for evidence of DIF when both the gender and interaction terms were included in the regression equation, as shown in Equation (3.3). Additionally, 291 item and focal group combinations across 217 items were flagged for evidence of DIF when both the race and interaction terms were included in the regression equation. Table 3.26 and Table 3.27 summarize the number of combinations flagged by grade. The percentage of combinations flagged ranged from 26% to 34% for gender and from 13% to 18% for race.
| Grade | Items flagged (n) | Total items (N) | Items flagged (%) | Items with moderate or large effect size (n) |
|---|---|---|---|---|
| 3–5 | 41 | 148 | 27.7 | 0 |
| 6–8 | 56 | 164 | 34.1 | 0 |
| 9–12 | 42 | 159 | 26.4 | 0 |
| Grade | Items flagged (n) | Total items (N) | Items flagged (%) | Items with moderate or large effect size (n) |
|---|---|---|---|---|
| 3–5 | 78 | 578 | 13.5 | 0 |
| 6–8 | 95 | 649 | 14.6 | 1 |
| 9–12 | 118 | 642 | 18.4 | 0 |
Using the Zumbo and Thomas (1997) effect-size classification criteria, all combinations were found to have a negligible effect-size change after the gender and interaction terms were added to the regression equation. When using the Jodoin and Gierl (2001) effect-size classification criteria, all combinations were found to have a negligible effect-size change after the gender and interaction terms were added to the regression equation.
The results of the DIF analyses for race were similar to those for gender. When using the Zumbo and Thomas (1997) effect-size classification criteria, all but one combination were found to have a negligible effect-size change after the race and interaction terms were added to the regression equation. Similarly, when using the Jodoin and Gierl (2001) effect-size classification criteria, all but one combination were found to have a negligible effect-size change after the race and interaction terms were added to the regression equation.
Information about the flagged items with a non-negligible change in effect size after adding both the group and interaction term is summarized in Table 3.28, where B indicates a moderate effect size, and C a large effect size. In total, one combination had a large effect size. The combination flagged for DIF for the combined model is the same combination flagged for DIF for the uniform model. The \(\beta_3\text{X}G\) values in Table 3.28 indicate which group was favored at lower and higher numbers of linkage levels mastered. All combinations favored the focal group higher numbers of total linkage levels mastered and the reference group at lower numbers of total linkage levels mastered.
| Item ID | Focal | Grade | EE | \(\chi^2\) | \(p\)-value | \(\beta_2G\) | \(\beta_3\text{X}G\) | \(R^2\) | Z&T* | J&G* |
|---|---|---|---|---|---|---|---|---|---|---|
| 51571 | Asian | 6–8 | SCI.EE.MS.ESS3-3 | 15.02 | < .001 | 0.31 | 0.00 | .901 | C | C |
| Note. EE = Essential Element; Z&T = Zumbo & Thomas; J&G = Jodoin & Gierl. | ||||||||||
| * Effect-size measure. |
3.3 Conclusion
During the 2021–2022 academic year, the test development teams conducted reduced, virtual events for both item-writing and external review. Overall, 270 testlets were written for science. Additionally, following external review, the science test development team made 31 minor revisions, 250 major revisions to items, and rejected 26 testlets. Of the content already in the operational pool, most items had p-values within two standard deviations of the mean for the EE and linkage level, and only one item was flagged for non-negligible DIF. Field testing in 2021–2022 focused on collecting data to refresh the operational pool of testlets.